Freeways slash population in cities, and prompt growth in suburbs
Within city centers, the closer your neighborhood was to the freeway, the more its population declined.
In suburbs, the closer your neighborhood was to the freeway, the more it tended to grow.
It’s been obvious for a long, long time that the automobile is fundamentally corrosive to urban form. Not only do roads, highways and parking lots devour urban space, they also cause the dispersion of people and activity in ways that make it impossible in many places to live without a car. Cars, abetted by public policy, have remade cities in their image, and fostered car dependency, effectively acting as a paralytic toxin to urban living.
Even before we had good data, this was manifest to thoughtful observers, such as James Marston Fitch who wrote in The New York Times in 1960:
The automobile has not merely taken over the street, it has dissolved the living tissue of the city. Its appetite for space is absolutely insatiable; moving and parked, it devours urban land, leaving buildings as mere islands of habitable space in a sea of dangerous and ugly traffic.
Now, six decades later, we can look at the historic record to measure just how true this observation was. Federal Reserve economists Jeffrey Brinkman and Jeffrey Lin have looked at the historical relationship between neighborhood growth and proximity to freeways. Their data shows freeways have decimated city neighborhoods and propelled suburban population growth.
In the center of the region, more freeways are associated with population decline, and the closer you are to the freeway, the more population tends to decline.
Freeways are toxic to urban neighborhoods and a tonic to suburban sprawl
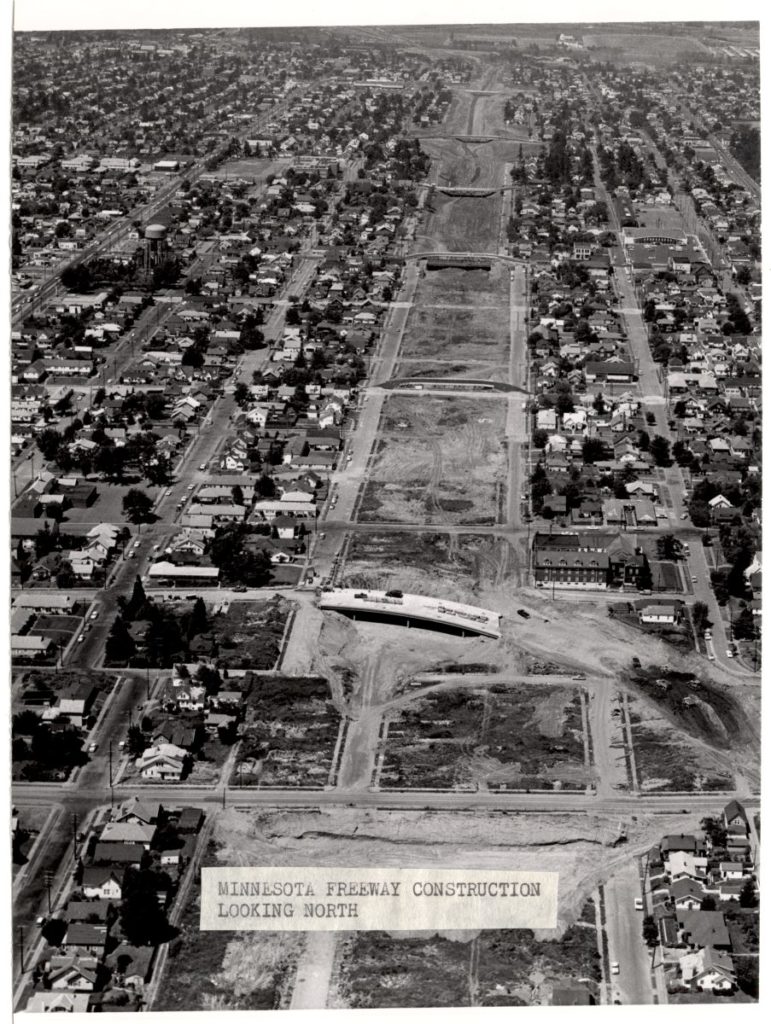
On the suburban fringe, freeways both tend to stimulate more population growth, and the most positive effect on growth tends to be quite close to the freeway, and the growth inducing effect attenuates the further one gets from the freeway. The devastation wrought by urban freeways isn’t limited just to knocking down houses, but extends to undermining the vitality of the surviving portion of a neighborhood. With fewer people and more traffic, a neighborhood loses its critical mass needed to support businesses and civic institutions, triggering a downward spiral. As images like these, from Portland’s Albina neighborhood make clear, freeways have devastating effects.

The authors’ key findings which aggregate data from 64 metropolitan areas for the period from 1950 to 2010 show the typical effects.
The authors have summarized their findings in one particularly dense graphic, which we present below. It deserves a bit of explanation. (For clarity, we’ve annotated it slightly with lines and shading to highlight key issues.)
First, the chart breaks all the neighborhoods (census tracts) in a metropolitan area into four columns, arrayed left to right, based on how close they are to the city center. The closest-in urban tracts are shown on the left (above the legend “city center”) and in increasing order of distance from the city center are three other groups, 2.5 to 5 miles away, 5 to 10 miles away, and 10 to 50 miles away. The vertical axis on this chart corresponds to the (log) growth rate of the population of neighborhoods between 1950 and 2010. We’ve drawn a line at zero (no growth), and shaded negative values (population decline) as yellow.
Finally, each column is subdivided based on the distance from a tract to the nearest local freeway. So, for example, the leftmost column shows neighborhoods within 2.5 miles of the city center, and the line within the column illustrates the change in population in those neighborhoods based on their distance to the nearest freeway.
Looking at that left-most column, we see that there’s nearly 100 percent decline in population in close-in neighborhoods a mile or less from the nearest freeway. In an urban setting freeways largely wipe out population. Population declines are less severe, but still substantial 2 and 3 miles away. The period 1950 to 2010 was one of urban decline, but as this chart shows, the urban neighborhoods that fared the best were the ones that were furthest from freeways.
Overall, the further you move from the center of the region, the more the effect of freeway proximity becomes positive for population growth. Population growth is negative close to city centers, split between declining and increasing 2.5 to five miles away, and increasing fastest in tracts 5-10 and 10 or more miles from the city center.
The inflection point where freeways go from being a detriment to a stimulus to population growth seems to be about five miles from the city center. Beyond 5 miles from the city center, the localized effect of freeways shifts from highly negative, to positive. From 5-10 miles, the highest levels of growth are neighborhoods closest to freeways. For those areas beyond ten miles, growth peaks about 2-3 miles from the nearest freeway, but declines sharply thereafter. Freeway access is a tonic to growth in suburbs and the metro periphery.
Brinkman and Lin’s work adds additional depth to research done on this subject by other economists. Professor Nathan Baum-Snow found that each additional radial freeway constructed through a city reduced the city’s population by 18 percent. In urban settings, freeways are toxic to population growth. Neighborhoods close to freeways in and near city centers suffer the most severe population decline.
Jeffrey Brinkman and Jeffrey Lin, “Freeway Revolts!,” Federal Reserve Bank of Philadelphia Research Department Working Paper 19-29, July 2019, https://doi.org/10.21799/frbp.wp.2019.29

