Affordable housing is an issue rife with statistics: median rents, median housing costs, percentage of people who are “housing cost burdened,” and so on. Previously, we’ve written about some of the issues with many of these statistics, including the untrustworthiness of most “median rent” reports and which rent statistics are more trustworthy.
But another issue—which we touched on last year—deserves more sustained attention: median housing costs are a really incomplete way to understand housing prices. This is especially true if what you really care about is affordability for lower-income households. After all, low-income households are unlikely to be buying mid-priced housing, even in an affordable market. What you really ought to be looking at, then, is housing that is relatively low-priced.
If this doesn’t make sense yet, imagine a town with three families and three houses. Two families are high-income, and one is low-income. In this situation, for the low-income family, it probably doesn’t matter whether the two more expensive homes cost $300,000 or $1,000,000—because they’re going to be getting the cheapest home regardless. What matters is how much that home costs. But the “median housing cost” won’t tell us anything about that.
There’s far less public data about non-median housing prices, but the Census does offer data on 25th percentile home values—that is, homes that are cheaper than 75 percent of all the housing stock in a given area. And that data is illustrative of some of the issues that measuring affordability with downmarket housing can demonstrate.
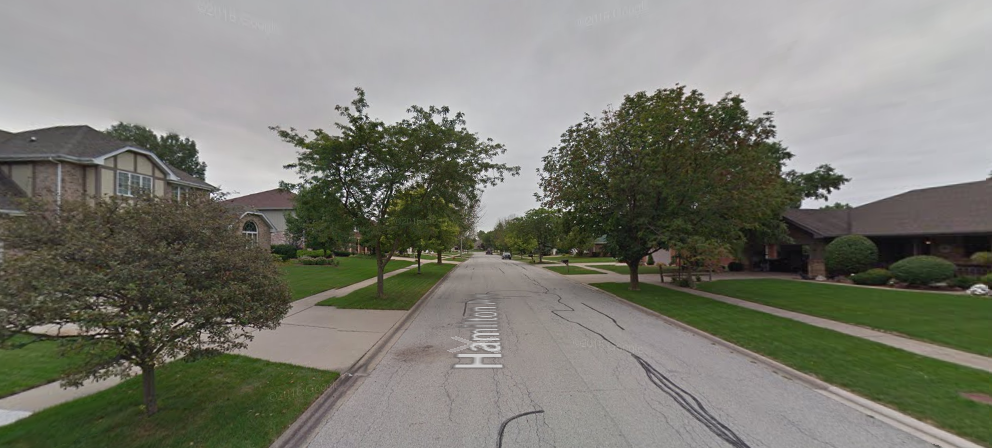
Take two suburbs in the Chicago metropolitan area, Frankfort and Oak Park. Frankfort is a newer town on the very southern fringe of the region. Predominantly new development—over 70 percent of homes were built since 2000—the housing stock is quite homogenous, with 95 percent of units single-family homes, and 94 percent owner-occupied.
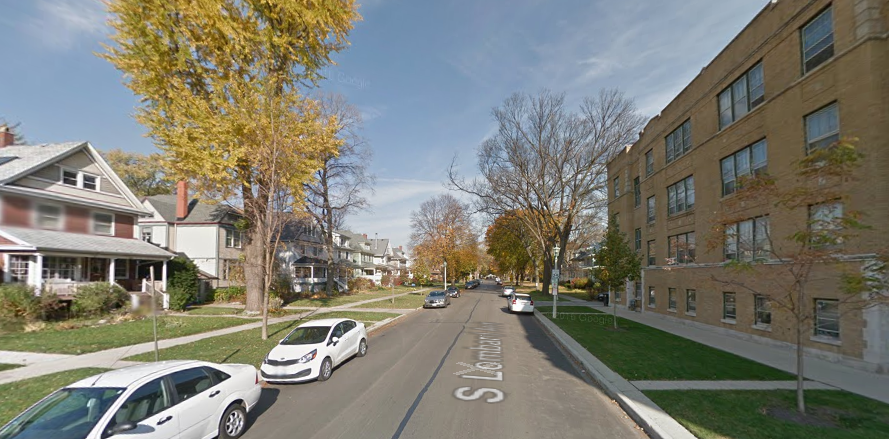
Oak Park, by contrast, lies on the western border of the city limits. With much of its development dating back to before the advent of zoning, it has a much more heterogenous housing stock, mixing large and small single family homes, as well as a large multifamily stock that ranges from a handful of downtown midrises to four-story apartment blocks to three-flats.
These towns have virtually identical median housing values, according to the 2014 five-year American Community Survey: $348,600 in Frankfort, and $354,400 in Oak Park. If the medians were all we looked at, we’d conclude that these two places were about equally affordable for low-income people, with Oak Park possibly being slightly worse.
But the 25th percentile prices tell a very different story. In Frankfort, with its limited range of types of housing, that figure is $269,500. But in Oak Park, where the median home value is slightly higher than Frankfort’s, the 25th percentile home is nearly $50,000 lower: $222,100.
That means a typical low-cost housing unit in Frankfort costs over 20 percent more than a typical low-cost unit in Oak Park. That’s a significant difference—it would increase the income level needed to stay under the (flawed) commonly used “cost burdened” threshold by 20 percent as well.
It’s also probably not a coincidence that Frankfort and Oak Park have very different income demographics. Just 16 percent of Frankfort households earn less than $50,000 a year, compared to 41 percent in the Chicago metropolitan area as a whole; in Oak Park, that number is 33 percent, much closer to the regional average. In other words, there seems to be a straight line from Oak Park’s relatively more diverse housing stock; to more diverse housing prices, as reflected by its lower 25th percentile home price; to more income-diverse residents.
This underscores an issue that we’ve repeatedly emphasized: contemporary zoning codes that widely separate different types of land uses and housing effectively make it illegal to build neighborhoods that have a wide range of housing types and price points. The kinds of neighborhoods that freely mix large and small houses, apartments, and nearby shops are illegal in most places and and those that do exist are the anachronistic legacy of the pre-zoning era.
Of course, median housing prices still matter, if for no other reason than the shortfall in housing in many major cities has made finding affordable housing difficult for mid-income households as well as low-income ones. And if a place has very high median housing costs, it’s likely that there will be problems further down the scale as well. But to really understand a city’s or neighborhood’s housing cost profile, we do need to go beyond the median, to see what relatively down-market housing looks like. As the examples of Frankfort and Oak Park, Illinois, demonstrate, even places with the same median housing costs can differ significantly at the lower end.
How do I find data on the 25th percentile rent? These data are gathered as part of the American Community Survey. To get reliable neighborhoood level data, you’ll want to use the Census Bureau’s pooled, five-year estimates; the latest data are from 2010-14. You’ll want to go to American Fact Finder, and visit Table B25057, “Lower Contract Rent Quartile, Universe: Renter-occupied housing units paying cash rent more information 2010-2014 American Community Survey 5-Year Estimates.” A table of 25th percentile rents for metropolitan areas is available here.
