The proposed I-5 Interstate Bridge Replacement (IBR) Project will be paid for in part by $2.80 to $4.30 tolls charged to travelers. These tolls will cause tens of thousands of vehicles per day to stop crossing the I-5 bridge; and most traffic will divert to the parallel I-205 bridge, producing gridlock, according to IBR consultant reports and Metro travel demand modeling.
OregonDOT and Washington State DOT officials have offered vague and largely meaningless claims about potential diversion from tolling the I-5 bridge, and failed to disclose actual analyses done this subject by their consultants.
City Observatory obtained—via public records requests—toll revenue estimates prepared by IBR contractor Stantec, and travel demand modeling prepared by Metro for the IBR project. These studies show that tolling I-5 will dramatically reduce I-5 traffic, with most vehicles diverting to I-205.
Tolling I-5 will cause traffic levels on I-5, currently about 140,000 vehicles per day will fall by almost half, and will permanently depress I-5 traffic
Tolling I-5 will cause more than 30,000 vehicles to divert to the parallel Interstate 205 bridge, likely producing gridlock.
The new toll revenue projections echo exactly the findings of studies for the earlier carbon copy of this same project (then called the Columbia River Crossing) as well as the experience of tolled bridges and highways elsewhere in the country.
Highway agency claims that investment grade forecasts are unlikely “worst case scenarios” are untrue: Traffic levels routinely fall below levels predicted in investment grade forecasts, as happened with the Tacoma Narrows Bridge, and many other similar projects.
IBR traffic projections and diversion estimates are a DOT state secret
Although repeatedly asked about diversion, WSDOT and ODOT officials have steadfastly refused to share their toll and traffic estimates with the public. At a November 27, 2023 meeting of the joint Oregon and Washington legislative committees overseeing the project, IBR officials offered only the vaguest possible description of diversion.
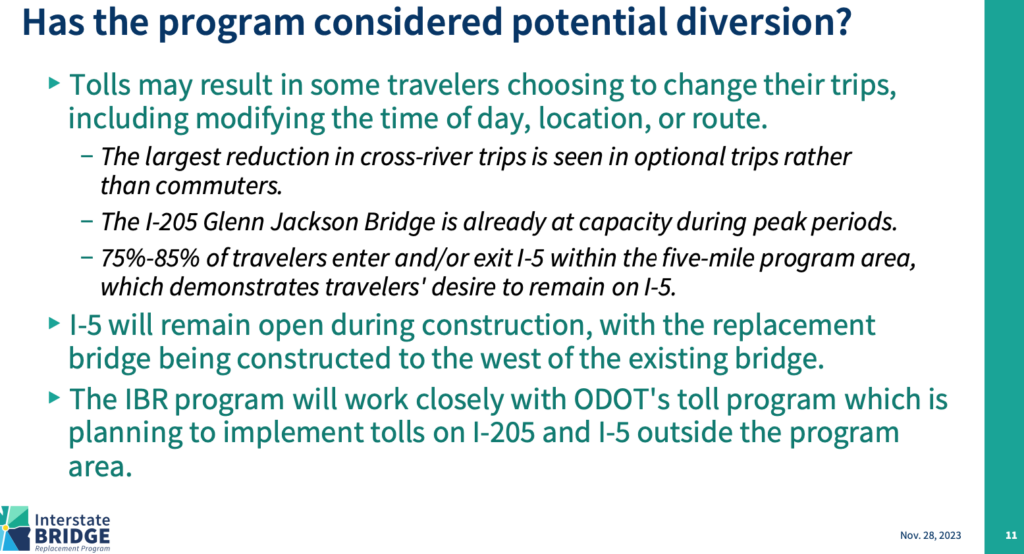
Their slide show and testimony omitted the fact that IBR and its consultants have already prepared detailed estimates of likely diversion.
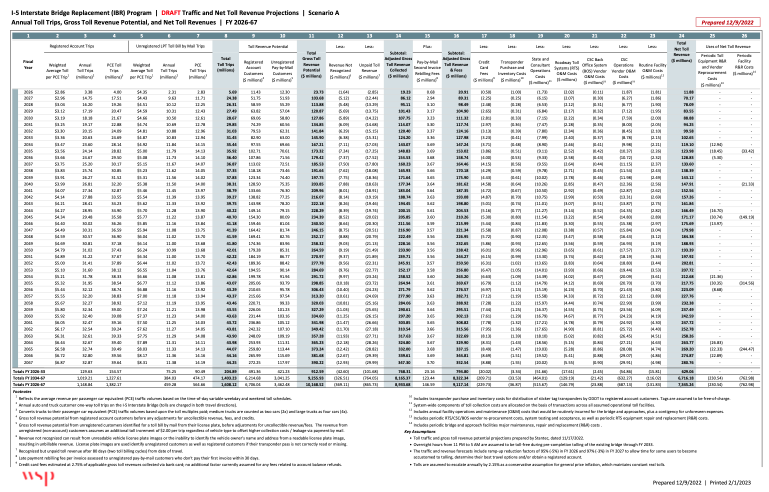
After filing a public records request, we obtained toll-related financial projections prepared by IBR consultants that show the estimated tolls that will be charged, the amount of revenue tolls would raise, and the average level of traffic using the I-5 bridge under tolls. The appendix to this report shows “Scenario A” of the project’s financial analysis, prepared by consultants WSP using traffic projections made by another consultant, Stantec. Stantec’s work is a so-called “Level 2” study of traffic levels. We converted the annual data reported in these financial reports to average weekday traffic.
Previously secret IBR “Level 2” traffic studies show massive diversion
The financial report indicates that the IBR will begin charging tolls on the existing I-5 bridge in 2026, just as the project starts construction. This “pre-completion tolling” will start out an an average of $2.80 per passenger car (peak tolls will be higher; off-peak tolls lower). Average tolls rise each year and will be $3.30 per car in 2033 which the new bridge opens, and will rise to $4.34 in 2045. (Again, peak hour tolls will be even higher).
Tolling will depress traffic on I-5 and cause diversion to I-205. The following chart shows the predicted daily level of trips across the I-5 bridge according to the IBR’s published environmental analysis. Currently about 140,000 vehicles per day cross the I-5 Columbia River Bridges The red line on the chart shows what Stantec predicts will happen to daily I-5 traffic when tolls are implemented in 2026. Traffic will fall by almost half, to only about 70,000 vehicles per day.
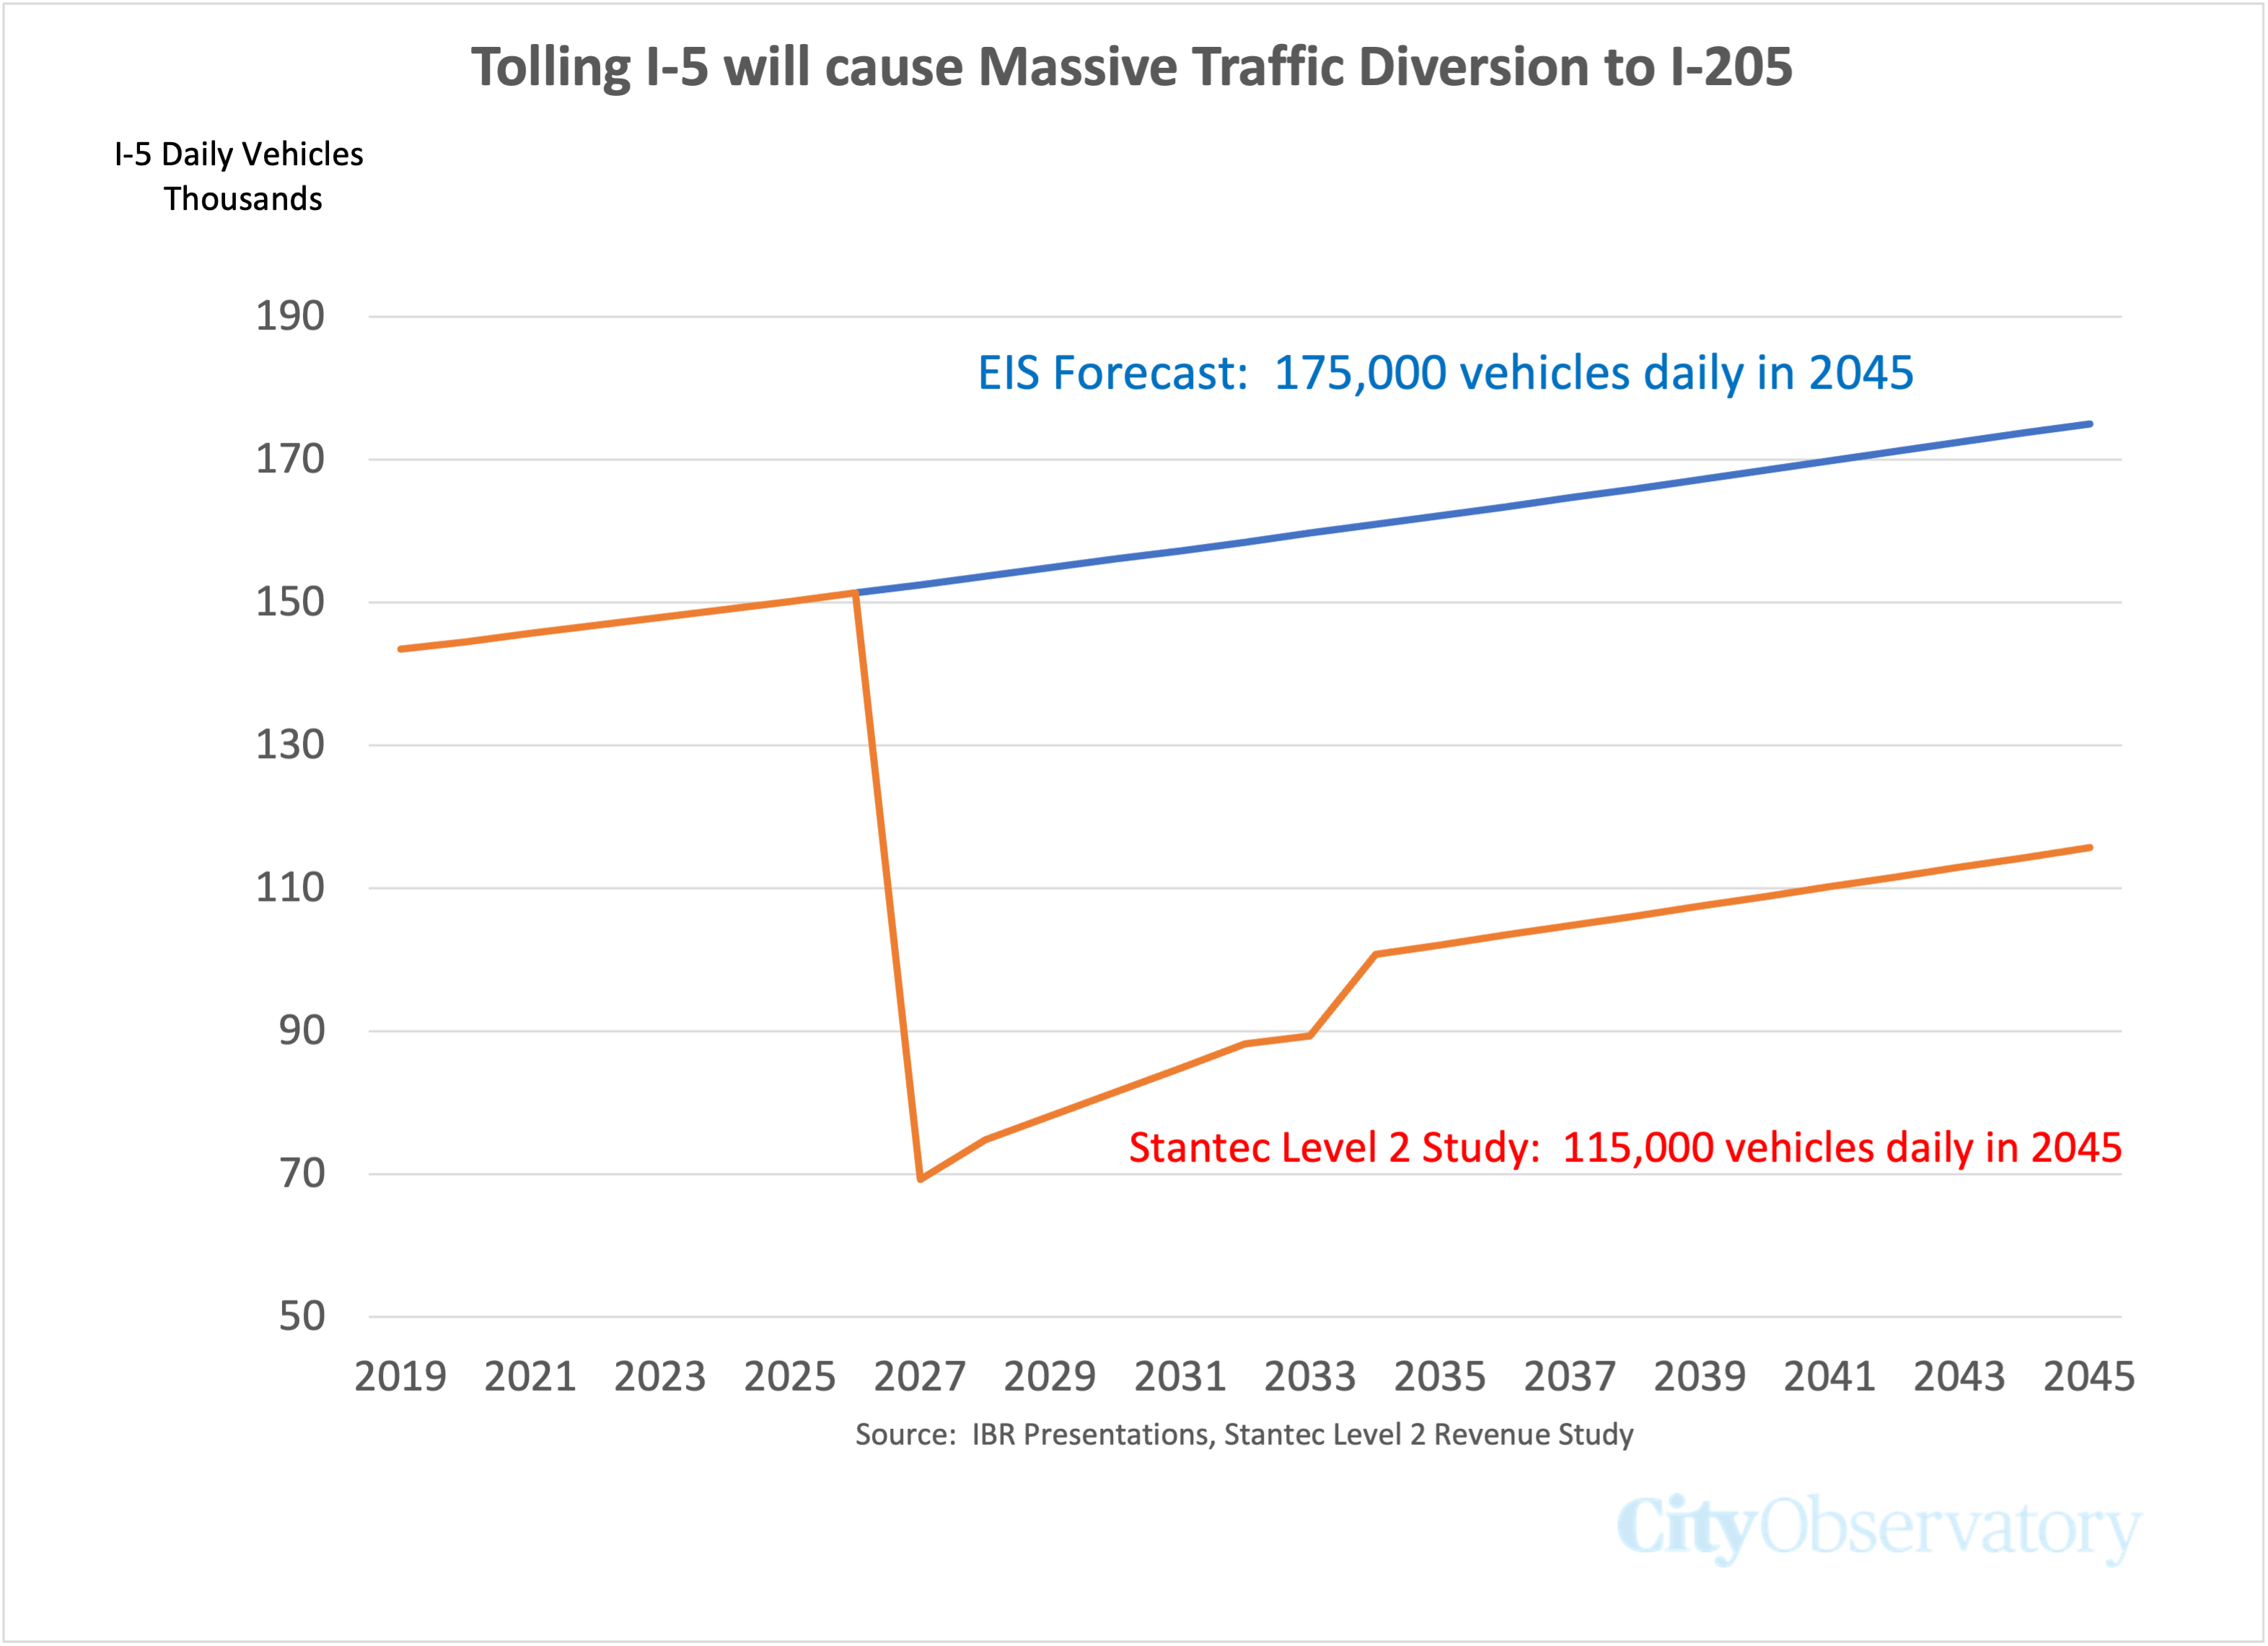
These high toll levels will prompt many users to avoid the I-5 bridge. Some may shift to transit, or avoid traveling across the Columbia River. But most of this traffic will shift to the I-205 bridge, which is not tolled. Metro, the regional’s transportation planning agency has used its regional travel demand model to estimate traffic diversion under various tolling scenarios. On average, it finds that about 55 percent of diverted traffic will instead cross the I-205 bridge. This means that tolling I-5 will add more than 30,000 vehicles per day to I-205.
The “Level 2” study confirms the diversion estimates generated a decade ago.
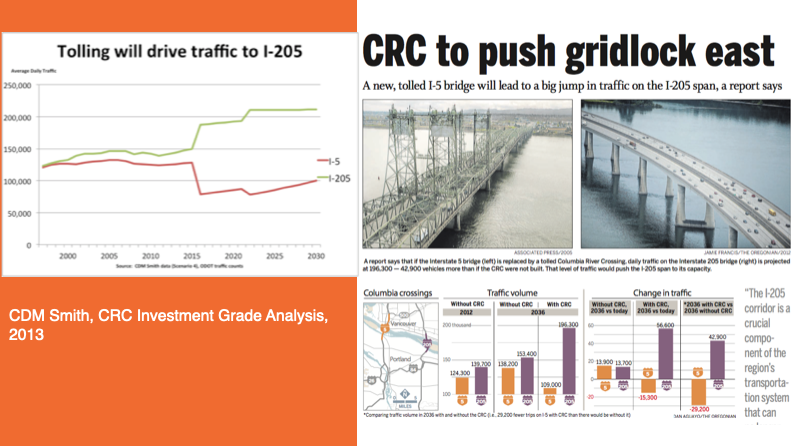
The results of the 2023 Stantec Level 2 study confirm the results obtained in the CDM Smith Investment Grade Analysis for the Columbia River Crossing a decade ago. In 2013, the Oregon and Washington highway departments paid CDM Smith about $1.4 million to produce an “investment grade” study that would qualify the project for federal loans and private bond financing. CDM Smith’s investment grade analysis (IGA), assumed that pre-completion tolling would start in 2019, and when it did, traffic on the I-5 bridge would fall precipitously, and remain below historical levels indefinitely. The CDM Smith study also concluded that the bulk of this traffic would shift to the I-205 bridge.
Louisville, Kentucky built the equivalent of the IBR, and tolling produced massive traffic declines and diversion
This is exactly what has happened with comparable tolled projects. A decade ago, Louisville Kentucky built a project extremely similar to the I-5 bridge replacement, doubling the capacity of I-65 across the Ohio River from 6 lanes to 12 lanes. It imposed a modest toll of $1-$2 for crossings, and this had the result that traffic on the expanded I-65 bridges fell from about 130,000 vehicles per day (nearly identical to the current I-5 bridges) to about 65,000 vehicles per day. As a result, the expanded bridge capacity is going almost entirely unused. Traffic cameras show that even at 5pm on a typical weekday afternoon, the bridges are almost empty.

Here’s the average daily traffic count on I-65, according to data tabulated by the Indiana Department of Transportation. In the years just prior to the tolling, traffic was in the 135,000 to 140,000 vehicles per day level. But as soon as tolling went into effect, traffic dropped to barely 60,000 vehicles per day (with a very slight further decline due to Covid-19 in 2020).

Investment Grade Forecasts are not “worst case” estimates
The staff of the IBR has claimed that the investment grade analyses are financial “worst case” scenarios that will never be born out in practice. That’s simply false. The federal government and bond rating agencies require the preparation of independent, investment grade forecasts because state highway department forecasts are unreliable and are generally dramatic over-estimates. Investment grade forecasts are more realistic, but also tend to be over-optimistic; they are not described by their authors as “worst-case” scenarios, and as we’ll see, traffic levels regularly come in below levels forecast by investment grade analyses.
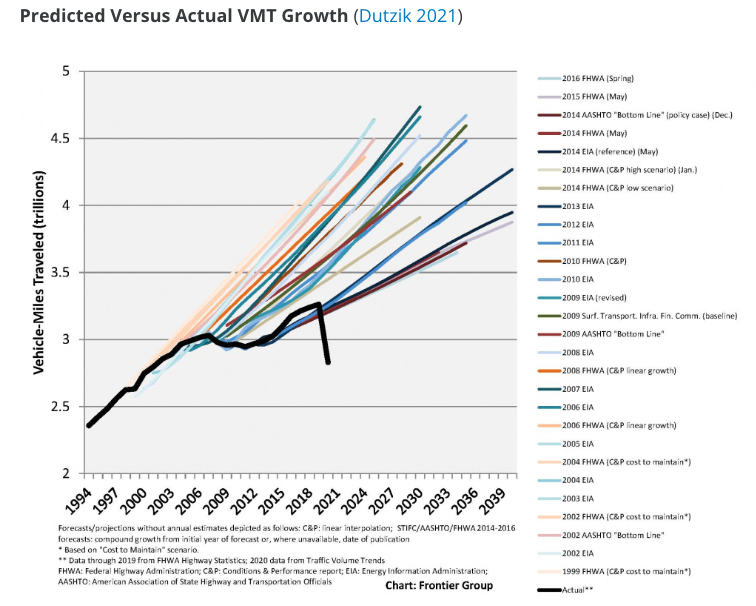
First, to be sure, highway department forecasts wildly overstate future traffic growth. A comprehensive review of two decades of traffic growth projections prepared by state transportaton departments, the Federal Highway Administration and other groups, like AASHTO (the highway agency lobby), shows that they continually predict “hockey-stick” growth patterns that have never been realized in practice.
While investment grade analyses are not as egregiously bad as these hockey-stick forecasts, they tend to consistently over-estimate actual traffic levels. The problem of over-estimating traffic levels (and associated toll revenues) is endemic. Bond rating agency Fitch issued a scathing report on toll forecast errors. They warned that over-estimating revenue is common in the industry and is a key cause of financial problems for toll-financed projects. The Fitch message, summarized in the trade publication, Toll Roads News, is clear and stark:
They [Fitch] call demand forecasting “a key vulnerability,” adding: “The probability of over-estimation remains high despite decades of experience with forecasting demand on transport projects. Many greenfield projects over the years across many jurisdictions have suffered from this… While other risks have been manifested in many cases, defaults on debt have largely been driven by under-performance relative to original projections.”
(emphasis added)
Investment grade forecasts also routinely suffer from optimism bias, as demonstrated by international expert (and Oregon State Treasury adviser) Robert Bain‘s comprehensive review of industry practice:
“The standard of some traffic and revenue studies, supporting infrastructure investments worth billions of dollars, is truly appalling,” Bain said. “Forecasts are commonly used to ‘sell’ deals to potential investors, insurers or rating agencies — so they are exposed to manipulation.”
One need look no further than the Tacoma Narrows Bridge in Washington State, the nearest highway project that has been subjected to an investment grade forecast. Wilbur Smith (the predecessor of CDM Smith) prepared the investment grade forecast for the Tacoma Narrows Bridge. It predicted that traffic on the bridge would grow at an annual rate of 1.7 percent per year after the capacity of the bridge was doubled. In fact, through 2019 (i.e. prior to the pandemic) actual traffic growth was only about a third that fast (traffic up 0.6 percent). The result is that toll revenues are dramatically lower than projections, necessitating repeated bail outs from state highway funds.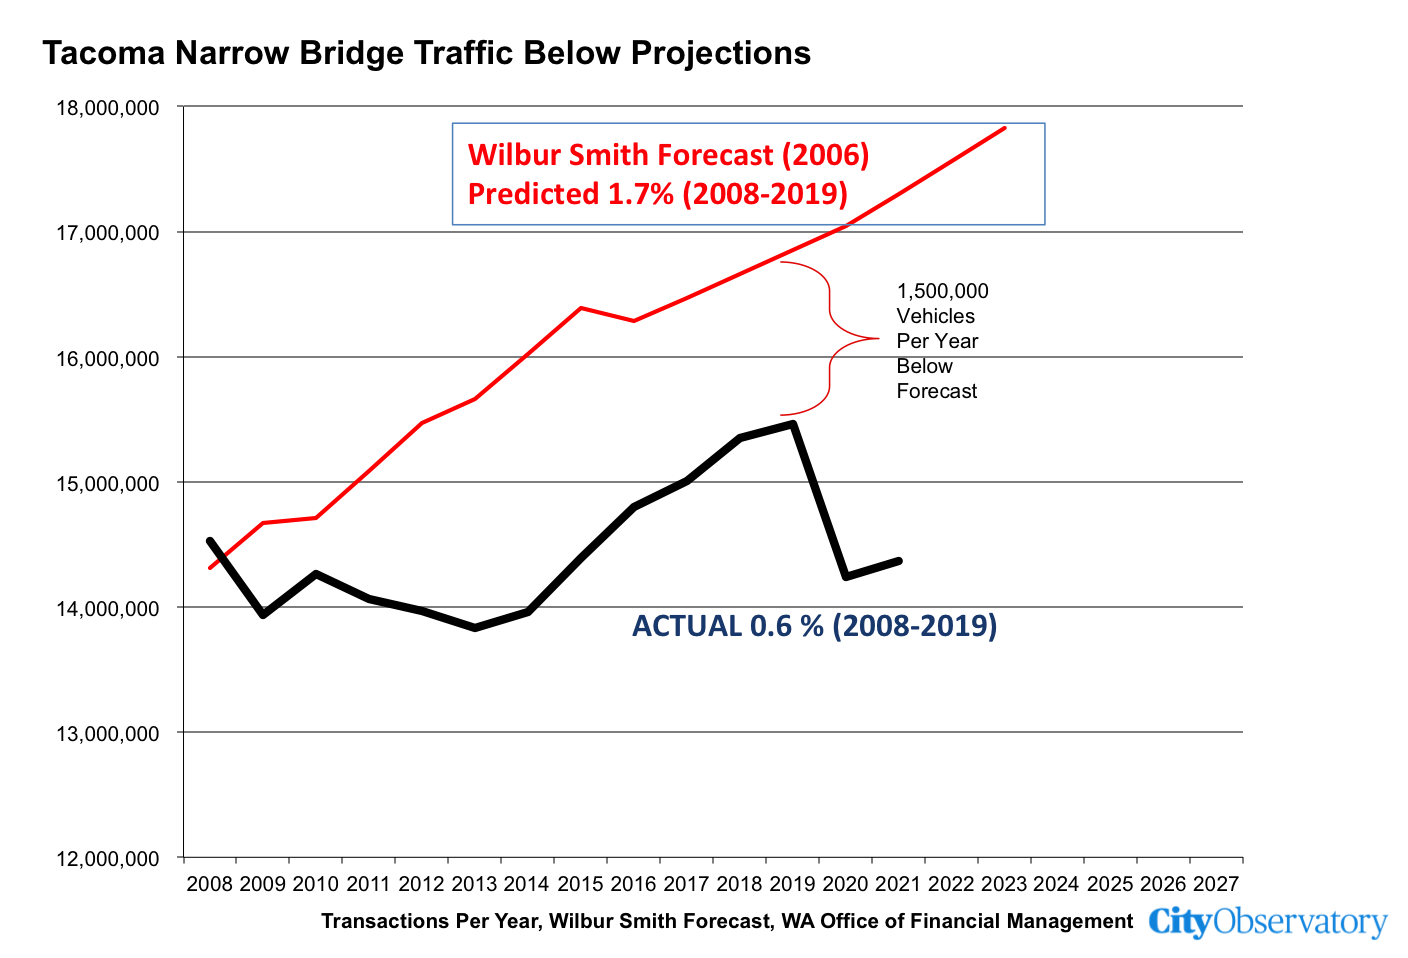
Over-predicting traffic is commonplace for toll road studies, even those done for “investment grade” forecasts. Streetsblog reported that:
In 2012, the Reston (Virginia) Citizens Association completed a study [PDF] examining traffic projections provided by engineering firm Wilbur Smith (the company that did the very wrong Indiana Toll Road projections, now called CDM Smith). The group collected data from 26 toll road projects on which Wilbur Smith had produced the traffic projections. During the first five years that were forecast, traffic projections overshot actual traffic every single year, and by an average of 109 percent, according to the report.
In short, investment grade toll revenue forecasts are not as wildly unrealistic as the promotional forecasts produced by state highway agencies, but they still consistently over-estimate traffic volumes and toll revenues on newly tolled-roadways. They are decidedly not unrealistic worst-case scenarios as portrayed by IBR officials. As a practical matter, the results of the IGA’s confirm that overall traffic levels will be lower, and diversion to un-tolled parallel routes (in this case I-205) will be higher than acknowledged in IBR’s promotional forecasts. That will lead to vastly different community, environmental and economic impacts that portrayed in the project’s environmental impact statement.
Appendix: Scenario A Financial Analysis (disclosed pursuant to public records request)