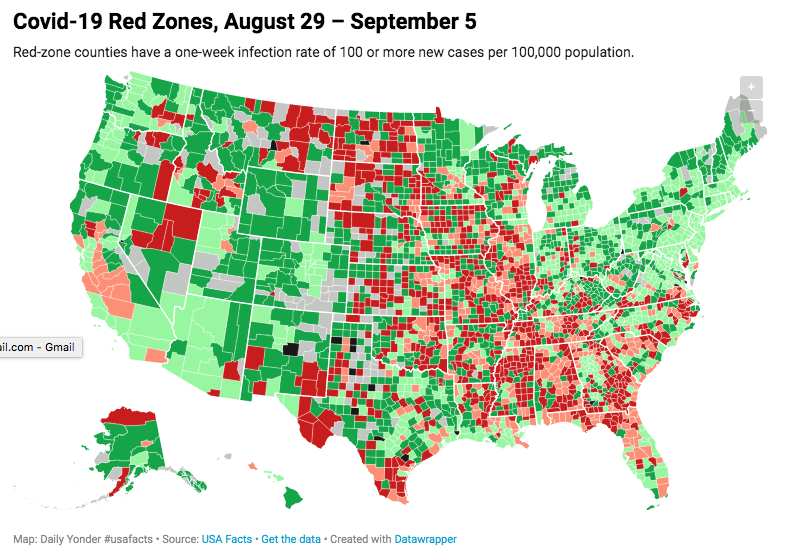
Covid-19 now disproportionately affects rural America, and is hitting red states harder than blue ones.
OK, reporters, we’re waiting for the stories about rural Americans decamping to cities (or suburbs) and from red states to blue ones, where they will be safe from the pandemics.
In the early months of the pandemic, reporters were quick to cast the Covid-19 pandemic as the rotten fruit of urbanism: density, we were told, was the cause of the disease, and its was now a certainty that Americans—at least those with the means to do so—would flee cities to escape the virus.
We pointed out—again, and again, and again—that the data didn’t support the connection between density and spread of the virus. Some of the world’s densest cities largely avoided the pandemic; some of America’s most rural areas, like the Navajo Nation, have been the hardest hit. The data show that overcrowded housing, poverty, lack of access to medical care, and poor adherence to social distancing protocols, not urban density, is what amplifies the spread of the disease.
It’s actually now the case that for the most part, the pandemic is worse in rural America than in the nation’s metro areas. Our friends at the Daily Yonder, who’ve been tracking the spread of the virus since early Spring, now conclude that
Rural and urban infection numbers are headed in opposite directions, meaning rural areas are now generating a disproportionately high number of new infections. Starting in early August, rural counties started to account for a larger share of Covid-19 cases (this week at 18%) and deaths (now 19%) than their population (at 14.03%).
They’ve mapped the places where the current level of new cases is highest: it’s clearly in the heartland of rural America. The worst hit areas stretch in a band of red from the Gulf Coast to the Dakotas.
Yonder’s analysis is echoed, using slightly different definitions and data, by Indeed’s Jed Kolko, who charts the steady decline of new cases in large metros, and shows that the nation’s rural areas and less populous metro areas now have higher rates of new cases than large urban areas.

Brookings Institution’s Bill Frey has also been tracking the Coronavirus (again, using a slightly different definition) and comes to very similar conclusions. Frey’s tabulations show that the distinction between overall case rates between urban and rural areas has basically disappeared in recent months.

Frey’s taken another perspective on the data, sorting data by the political leanings of states as well as by metropolitan size. Here’s his chart showing the recent rate of new cases per capita for different sizes of metro areas, split out by whether they’re located in a red state (voted for Trump in 2016), or a blue state (voted for Clinton). In every class of metro and non-metro area, current case rates are higher in red states than blue states.

The implication here seems clear: Places that lean Democratic appear to be much more successful in fighting the spread of the Coronavirus than roughly similar sized places in Republican states. Correlation isn’t causation, of course, but it is striking that more than six months after the seriousness of the pandemic became clear, that some places are doing a far better job of controlling its spread than others.
We’re just waiting now for a new wave of journalism on Covid-19: We want to hear reporters telling stories of people moving from rural areas and from Red States to escape the scourge of the Coronavirus. Given the standards of the earlier urban flight stories, this won’t be hard, just find one or two people who are moving from a rural area or red state to a blue city, toss in some quotes from the real estate agent who handled the transaction, and you’ve got your trend. C’mon reporters, don’t be the last one to get on this bandwagon.
Editor’s Note: This post has been revised to correct typographical errors.

