Segregated cities seem to be harder hit by the pandemic
Covid-19 prevalence is more strongly correlated with metropolitan racial and economic segregation than with urban density
The New York City metro area has been the epicenter of the nation’s Covid-19 pandemic and because it is the nation’s most densely settled area, it is easy to understand why some people have automatically assumed that density is a cause or contributor of the virus’s spread. A closer inspection of the data for New York and other cities shows that there’s little connection locally between urban density and the number of cases; the problem is actually worse in suburban counties than in New York City itself; and within the city, it is poor neighborhoods with overcrowded housing, not the densest places, that have the highest prevalence of the disease.
But density is only one aspect of urban spatial form. Another important feature is segregation, the extent to which people in different racial, ethnic and economic groups are separated from one another in the city. We’ve know for a long time that segregation is detrimental, especially to low income communities and people of color. For example, segregated communities have lower rates of intergenerational economic mobility. And metro areas with high rates of racial segregation tend to have larger black-white wage gaps than more integrated areas.
The effect of segregation on disease spread might be ambiguous: on the one hand, if people are effectively separated from one another, they it might be the case that disease would spread more slowly because of diminished contact between different groups. On the other hand, more segregated communities may be more vulnerable to the disease for the same reasons that segregation is associated with other negative outcomes.
Racial segregation and Covid-19 prevalence
How do levels of racial segregation across metropolitan areas correlate with the prevalence of Covid-19 cases. The following scatter chart shows Covid-19 cases on the vertical axis and the black-white segregation index on the horizontal axis. Black-white segregation is measured using the dissimilarity index, which runs from 0 to 1, where 0 indicates perfect integration (each census tract in a metropolitan area has the same racial composition as the metro area), and 1 indicates perfect segregation (each census tract is occupied by only a single racial group). Most US metro areas have a black-white segregation index between xx and yy.
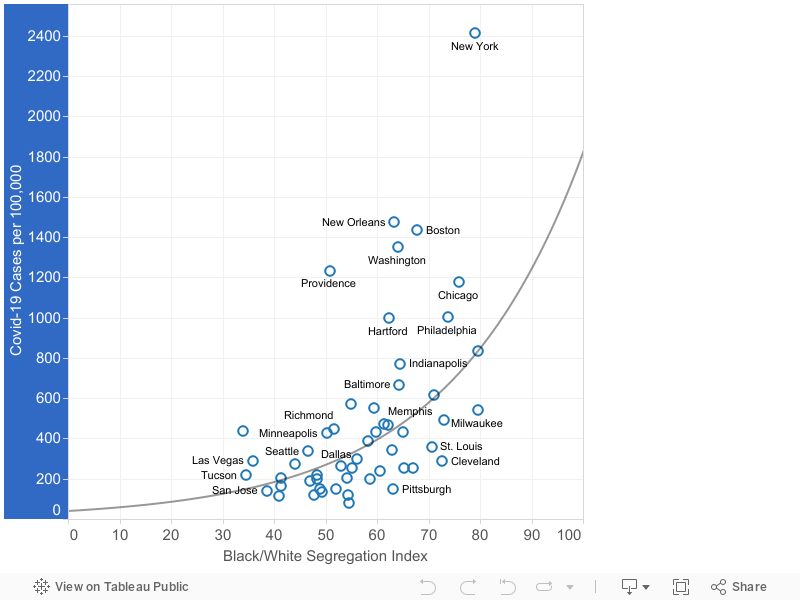
There’s a positive correlation: metro areas with higher levels of racial segregation tend to have higher levels of Covid-19. Statistically, the coefficient of determination (R²) for the relationship is .34, which is statistically significant at the 1 percent level.
Income segregation and Covid-19 prevalence
We can also look at the relationship between income segregation and Covid-19. Income segregation measures the extent to which households with different incomes live in different parts of a metropolitan area. Here we use the information theory index, which measures the overlap between different groups in each part of a metropolitan area. The index runs from 0 to 1, with zero indicating low segregation, and 1 indicating complete segregation. The typical US metro area has an income segregation level of about .15 to .20 on this index.
The following chart shows the income segregation index on the horizontal axis and the prevalence rate of Covid-19 on the vertical axis. Each marker represents the value for one of the nation’s 53 largest metro areas.
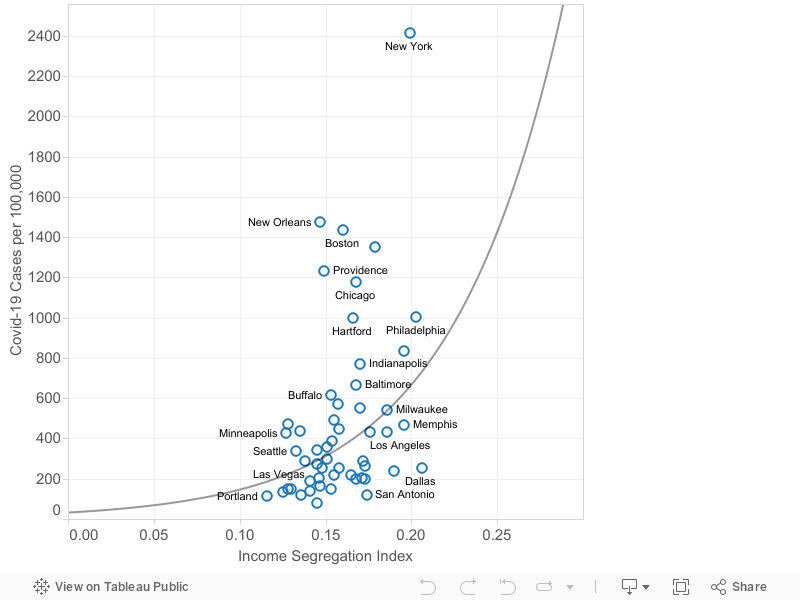
As before, there is a positive correlation between income segregation and the prevalence of Covid-19. Metro areas with higher levels of income segregation tend to have elevated levels of Covid-19 cases per capita. But the relationship is considerably weaker than for racial segregation (R² = .18)
Density and Covid-19 prevalence
Let’s now compare these estimates the the correlation between density and Covid-19 at the metropolitan level. To measure metro area density, we use the Census Bureau’s estimates of population-weighted density, which represent the density of the Census tract occupied by the median resident of a metropolitan area. The following chart shows density and Covid-19 rates.
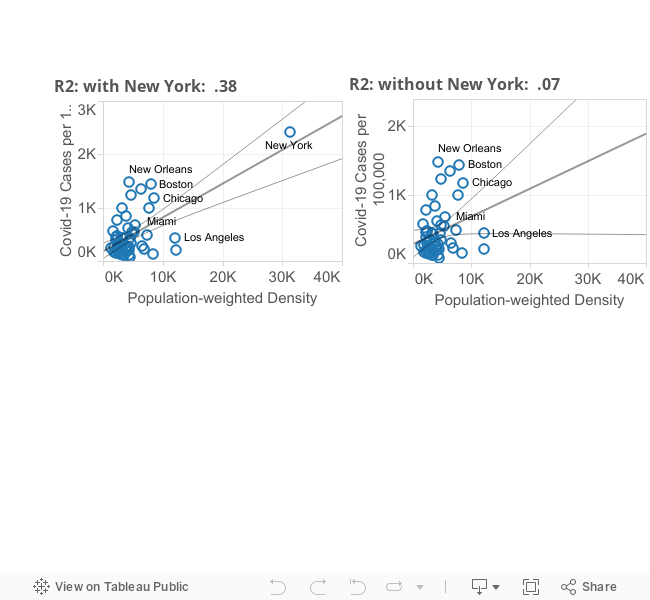
At first glance, their appears to be a strong relationship: the coefficient of correlation, R², is .38. But upon closer inspection, its apparent that the strength of this relationship is driven almost entirely by the high value for the New York metro area. If one excludes New York from the computation (as done in the right hand panel of this chart), the R² falls to .07, and is only borderline significant. (Excluding New York has no material effect on the correlation between either racial or economic segregation and the prevalence of the Coronavirus).
While density has gotten considerable media attention, these data suggest that segregation, especially racial segregation, may be a more salient feature of metropolitan form contributing to vulnerability to the pandemic. If so, that would suggest that building more inclusive cities is one key to lowering our collective susceptibility to future diseases.
Data notes. Our data on Covid-19 cases are drawn from the New York Times database and are aggregated by metropolitan area. Data are for the cumulative rate of reported cases per 100,000 population as of May 29, 2020. Black-white segregation indices are taken from the Brown University’s American Communities Project. Income segregation estimates for metropolitan area are from Bischoff and Reardon. Density data are from the Census Bureau.