The young and restless are continuing to move to the nation’s large cities
One trend that highlights the growing demand for city living is the increasing tendency of well-educated young adults to live in the close-in urban neighborhoods of the nation’s largest metropolitan areas. At City Observatory, we’ve been tracking this data closely for more than a decade. The latest estimates from the 2016 American Community Survey provide more evidence of this trend. Here are some key findings:
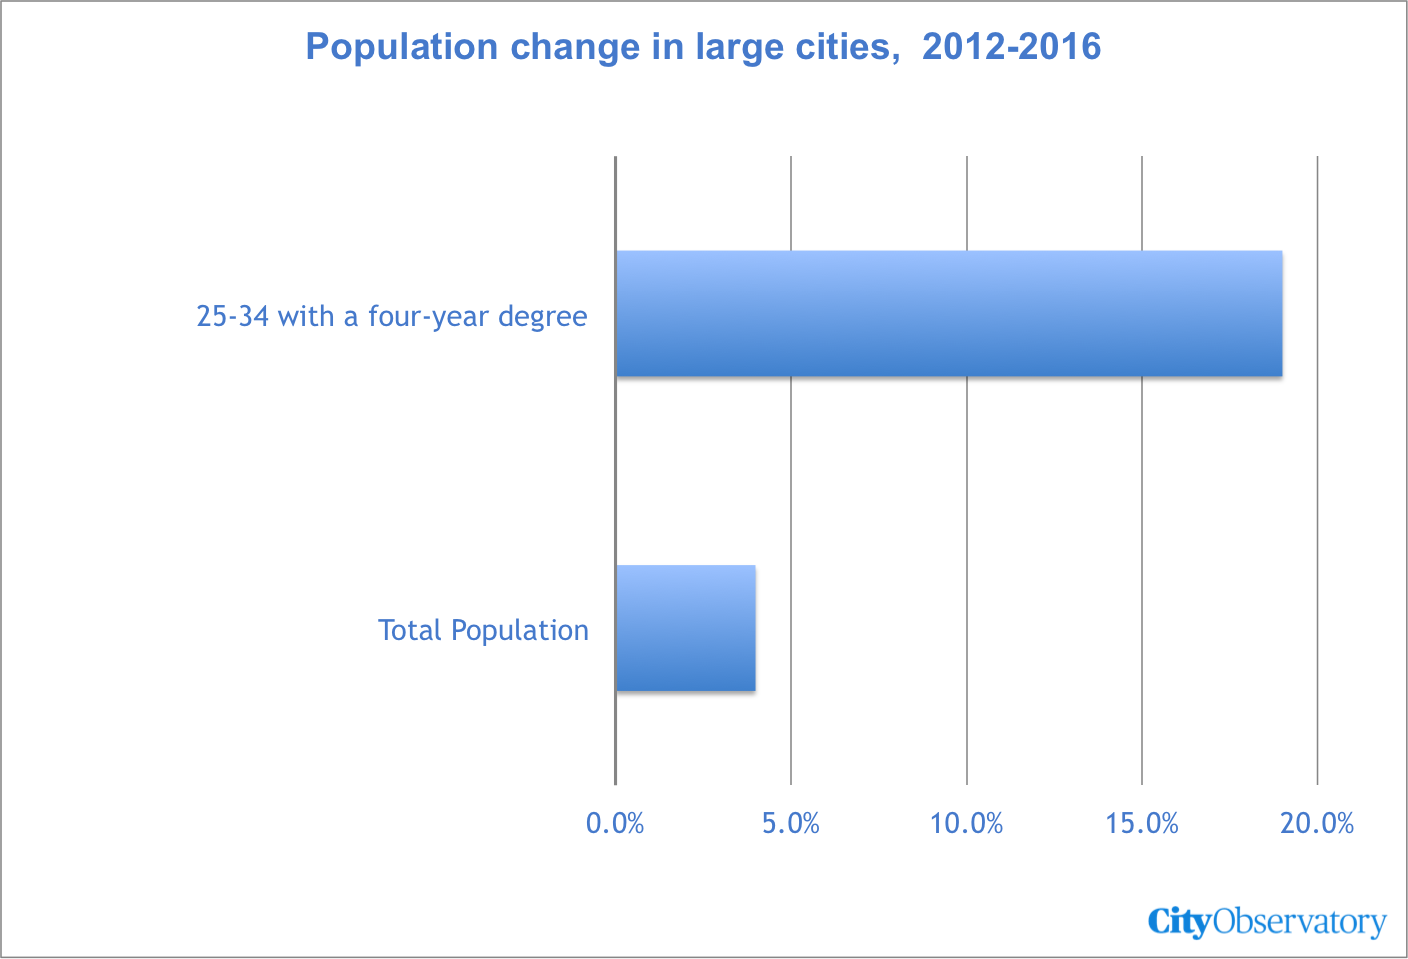
- The number of 25-34 year olds with four-year degrees living in large cities is growing almost five times faster than the overall rate of population growth in these cities: a 19 percent increase in 25-34s with a college degree compared to a 4 percent increase in overall population in these cities.
- The number of well-educated young adults living in the nation’s largest cities increased 19 percent between 2012 and 2016, about 50 percent faster than the increase outside these large cities.
- Well-educated young adults were already highly concentrated in large cities, and are more concentrated today; in 2012, a 25 to 34 year old with a four year degree was about 68 percent more likely to live in a large city than the typical American; by 2016, they were 73 percent more likely to live in a large city.
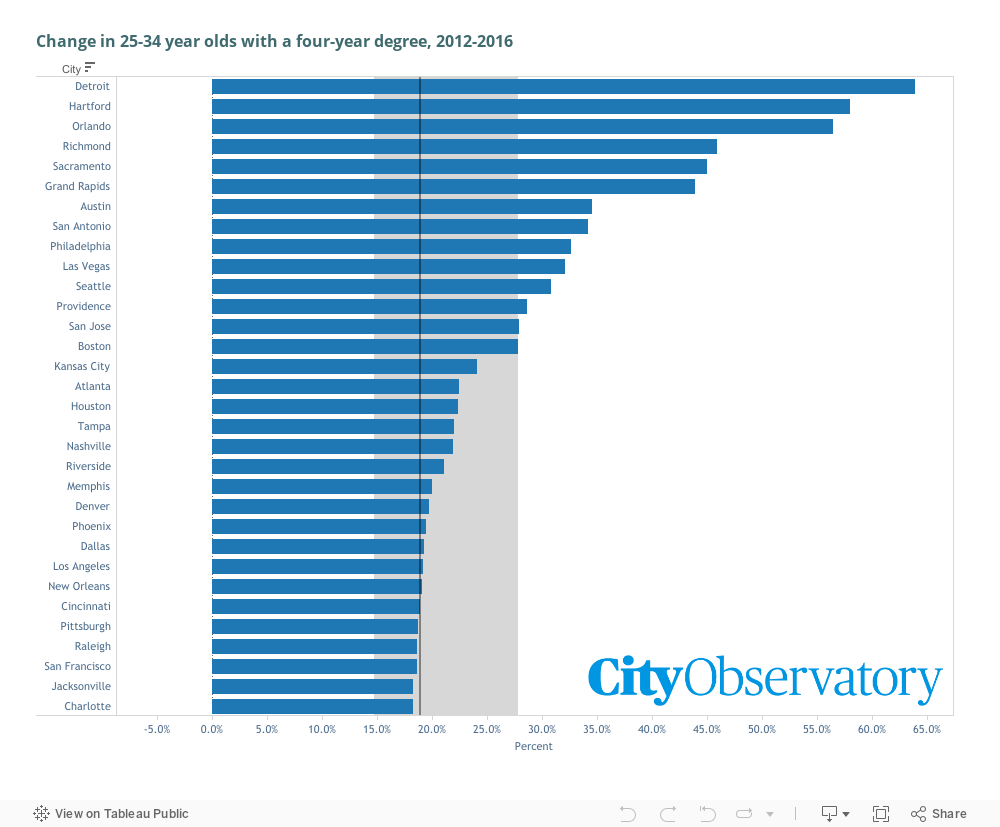
- The number of well-educated young adults increased in 51 of the 53 principal cities in the nation’s largest metropolitan areas. (Only Rochester, New York and Tucson recorded declines).
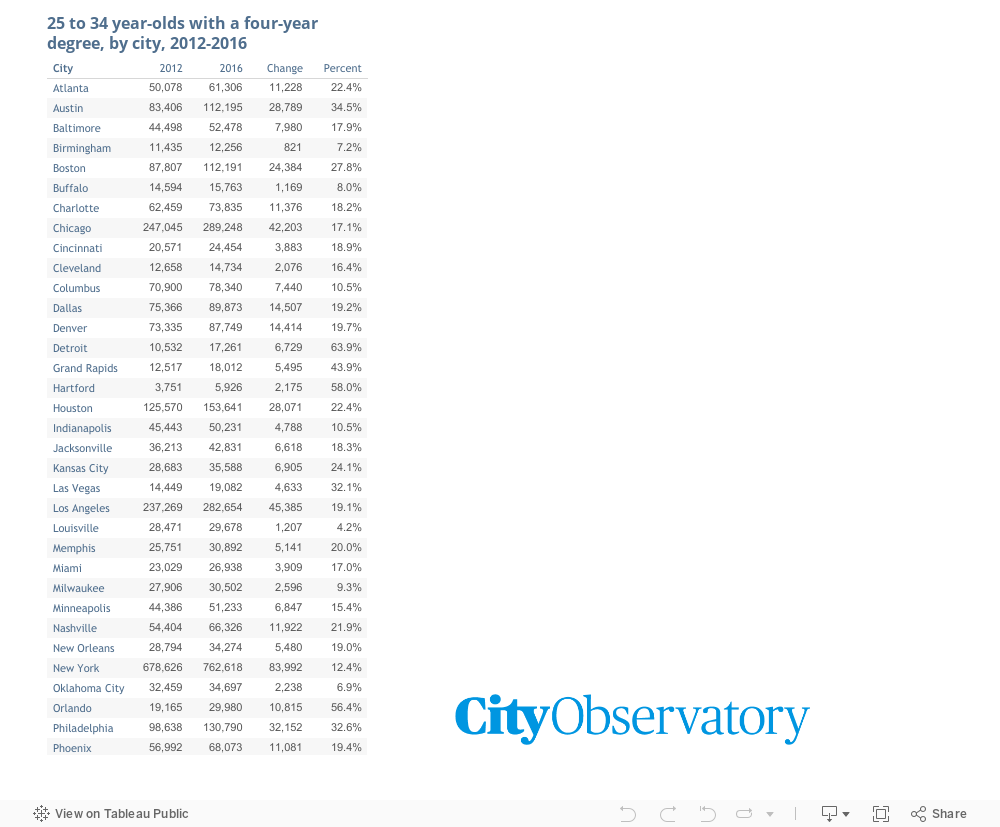
- Even troubled rust belt cities with declining populations recorded increases in 25 to 34 year olds with a four year degree over the past four years. Detroit added about 6,700 well-educated young adults in four years; Buffalo, Cleveland and Hartford all recorded significant gains.
Today, we’re focusing on the change in population in cities, as defined by their municipal boundaries. City limits are far from the best units for analyzing population trends, and especially for making inter-metropolitan comparisons. Cities are defined quite differently in different states; some cities represent only a fraction of the urban core (Miami, Atlanta, Hartford) , while others with generous annexation laws spill over into areas that chiefly are low-density suburban-style development (San Antonio, Jacksonville, Phoenix). As we’ve noted in the past, some cities are simultaneously experiencing population growth in denser more urban neighborhoods while recording population loss in more peripheral neighborhoods. So in many respects, these city-wide estimates can understate the movement of young adults to the urban core–a trend that’s better captured by looking at census tract level data (which is not yet available for 2016).
It’s important to keep in mind that cities are recording this growth in young adults in spite of serious headwinds. Cities, as we’ve frequently noted, haven’t made it easy to build additional housing, especially in the dense urban neighborhoods that are in highest demand. And young, well-educated workers are moving to cities in spite of rising rents. If housing supply were more elastic in cities, and rents were more affordable, its likely that even more young adults would live in cities.
We’ve heard the naysayers on the urban revival, with claims that we’ve somehow hit peak millennial, and observations that suburban growth is again (slightly) outpacing population growth in cities. But our analysis suggests that far from being disenchanted with cities, young adults, especially those with a higher education, are increasingly drawn to urban living. Our ability to accomodate the demands they are making on the scarce and slowly growing supply of great urban spaces and nearby housing is the real challenge we need to focus upon.
Data on the young and restless in large cities
We define the young and restless as 25 to 34 year olds with at least a four-year college degree. For each of the nation’s 53 largest metropolitan areas, we’ve tabulated the number of 25 to 34 year olds with a college degree living in the most populous (first-named) city in each metropolitan area. These data are compiled for the population within city limits, as reported in the American Community Survey. Data are subject to sampling error. In addition, individual city data may be affected by annexations or other boundary changes over time. We present data from 2012 and 2016.