The price of the I-5 “bridge replacement” project just increased by more than 50 percent, from $4.8 billion to $7.5 billion
ODOT and WSDOT are blaming “higher inflation” for IBR cost overruns
As we’ve noted, the Oregon Department of Transportation has a long string of 100 percent cost-overruns on its major projects. Almost every large project the agency has undertaken in the past 20 years has ended up costing at least double–and sometimes triple–its original cost estimate.
The data don’t support their claim–their own agencies official projections of future construction price inflation show a negligible change from 2020 levels.
Higher construction cost inflation accounts for only $300 million of a $2.7 billion cost increase.
The cost estimate for the I-5 bridges just jumped by 54%, from $4.8 billion to as much as $7.5 billion. The principal culprit according to the Oregon and Washington highway departments is “higher inflation.”
Project director Greg Johnson lamented to the Portland Tribune:
“Nothing gets cheaper as time goes on. Construction projects across the country are experiencing unprecedented cost increases due to supply chain issues and increasing material and labor costs as well as other factors, and our program is no exception,” Johnson said.
But the project’s earlier projections fully anticipated that there would be inflation—it was no surprise. The only question is whether the recent spate of construction cost increases somehow account for a greater than 50 percent increase in the total cost of the project in just the three years since its latest “inflation-adjusted” estimate.
The claim that the increase is due to inflation is not borne out by either WSDOT or ODOT’s current official forecasts of future construction cost inflation. Both Oregon and Washington prepare such forecasts. The Oregon forecast recognizes a short-term spike in construction costs, but expects construction inflation to settle down to historic levels. This from their October 2022 forecast
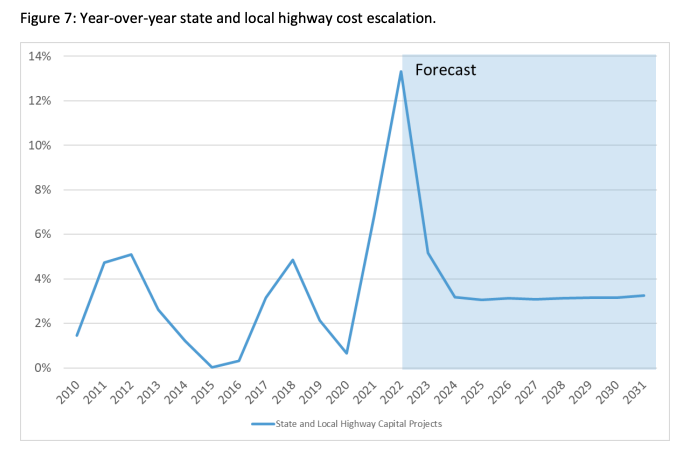
From 2023 through 2031, ODOT expects that construction cost inflation will be about 3 percent per year.
Similarly, Washington’s latest highway construction cost index calls for construction costs to increase in the 2-4 percent range from now through 2030. WSDOT data show the same spike in 2021, but expect prices to actually decline in 2023, and then stabilize at a little more than two percent per year through the remainder of the decade.
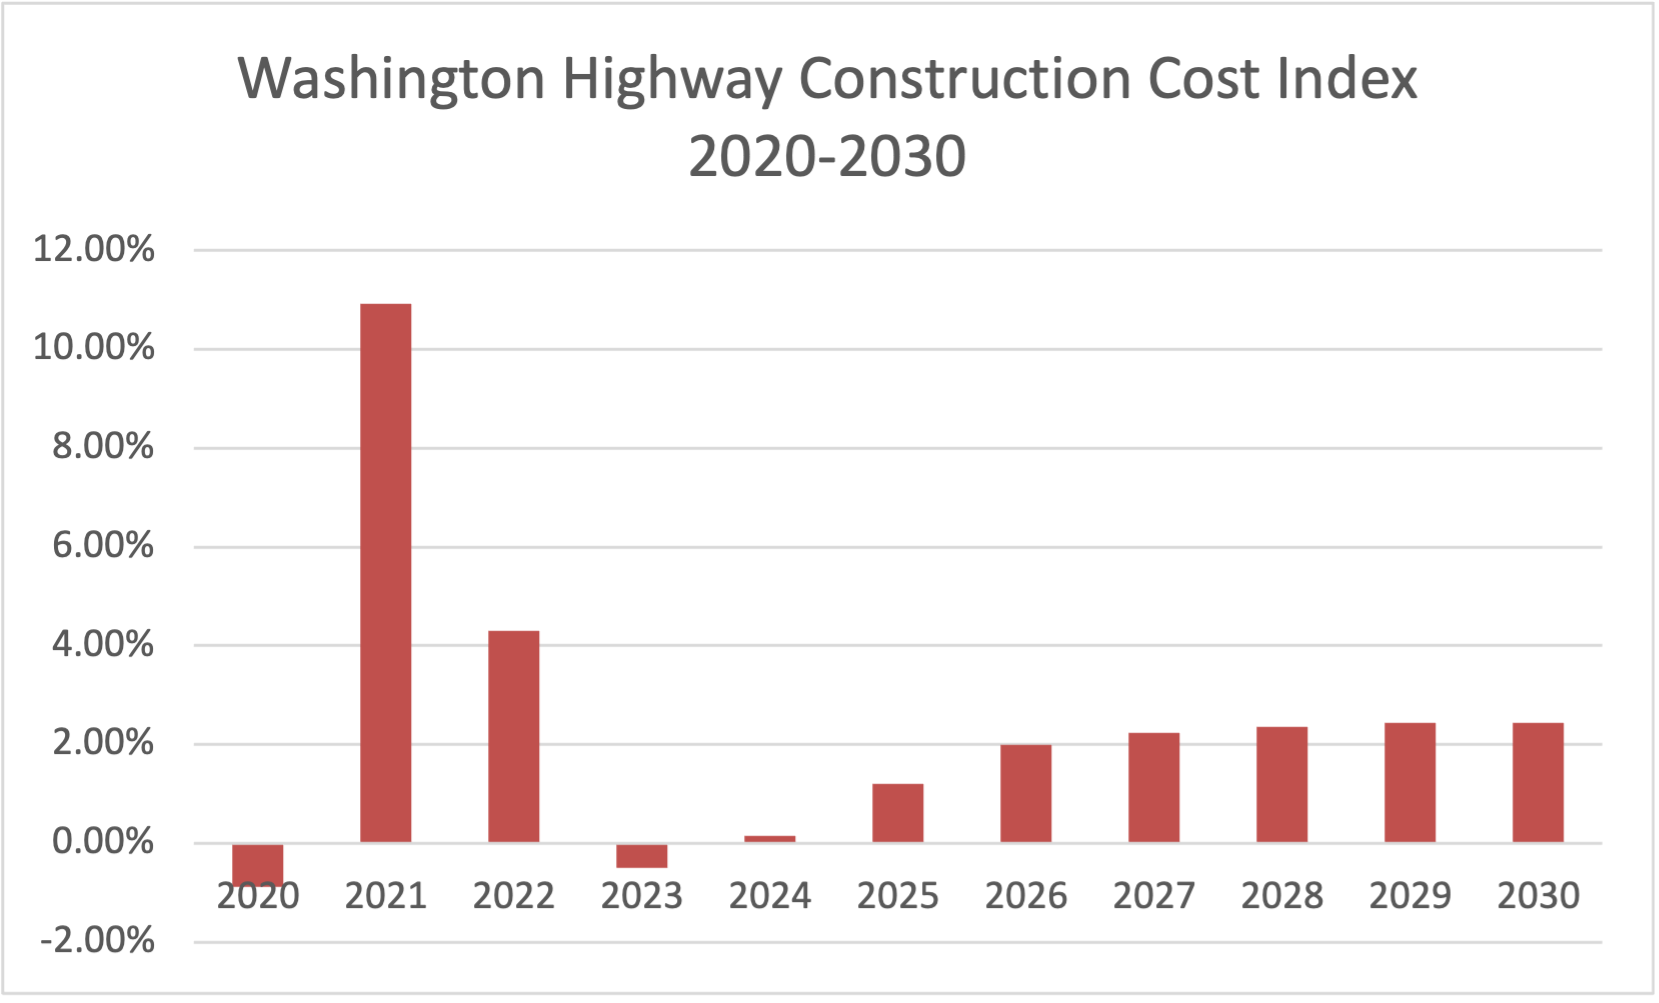
From 2020 through 2030, WSDOT forecasts construction cost inflation of 2.4 percent per year (including the 10 percent increase in 2022).
That represents almost no increase over the inflation that IBR officials said they had used in constructing their earlier forecasts of the IBR cost. (Keep in mind that cost estimates are made in “year-of-expenditure” dollars and according to their testimony to the Oregon Legislature, they model assumed the same construction time frame as the earlier estimates. In January of 2021, the IBR team described the methodology they used to construct their estimates and predicted construction cost inflation of 2.2 percent to 2.3 percent per year after 2020:
As with the construction cost inflation factor, the program team used WSDOT’s Capital Development and Management (CPDM) historical and forecast cost indices for Preliminary Engineering (PE), Right-ofWay (RW) acquisition, and Construction activities (CN), using third-party data sources and statewide experience. The values used to escalate fiscal year (FY) 2012 dollars to FY 2020 are based on these indices by the three expenditure types, which include historical data through FY 2019. The overall effect of the three historical cost indices that were used to inflate from FY 2012 to FY 2020 equates to an average annual inflation rate from 2.0% to 2.2%, depending on which capital cost option is selected. Projected inflation rates by year beyond FY 2020 vary, averaging between 2.2% and 2.3% when applied to the expenditure schedules for the capital cost options.
The critical factor here is the increase in expected inflation over the next decade or so between the project’s 2020 estimate and its new estimate. In 2020, they said the price estimate was based on an expected inflation rate of 2.2 to 2.3 percent. According to Washington’s official forecast the rate is now expected to be 2.4 percent per year through 2030; and for Oregon, the rate is predicted to be about 3 percent per year through 2031. This relatively low rate of inflation would do little to raise project costs. Over the next 10 years, 3 percent inflation per year rather than 2.2 percent inflation per year, would be expected to increase a $4.8 billion construction budget by about $300 million. This hardly accounts for the increase in maximum construction cost to $7.5 billion.
By not showing their work, and describing exactly how their inflation estimates changed between their 2020 project cost estimate and their current 2022 cost estimate, the IBR is exaggerating the importance of inflation, and downplaying its inability to accurately calculate future costs. Its easy to blame inflation, but if a changed inflation outlook is really the cause of the cost increase, they should use their own agencies official estimates to show exactly how much the change in inflation affects the project’s cost: they haven’t.
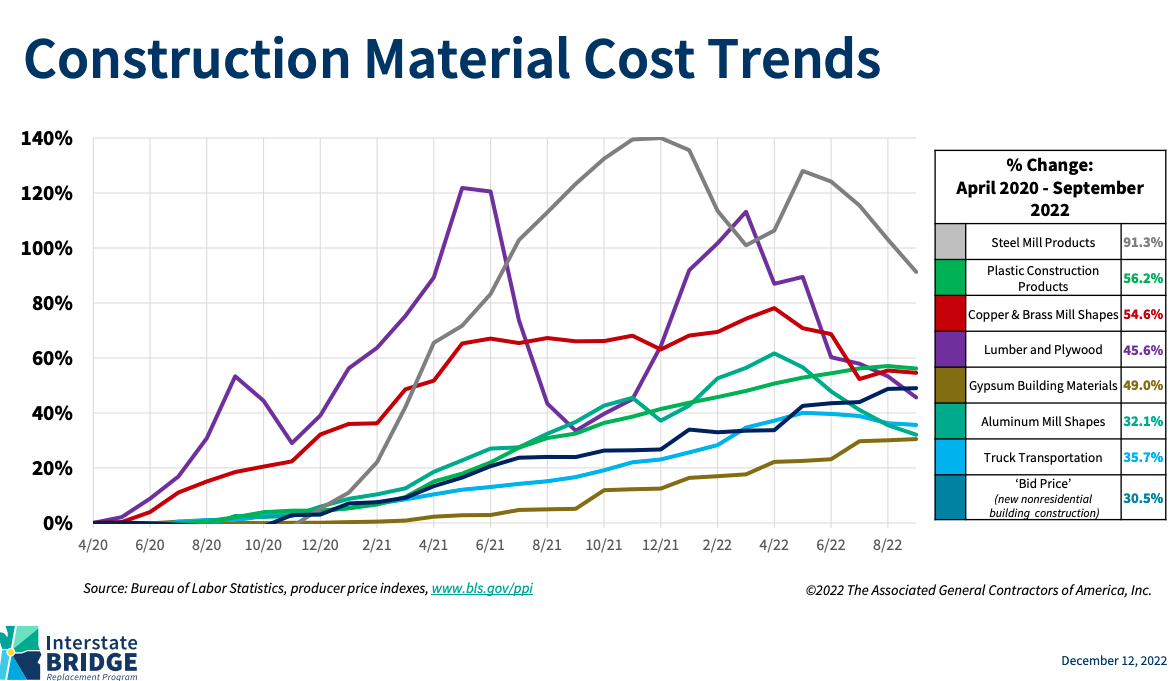
IBR officials presented a scary looking, but largely irrelevant chart showing the fluctuation of prices of a number of building materials. Never mind that at least three of these categories–gypsum, lumber and aluminum–have almost no relevance for bridge construction projects.