An imagined decline in trip-making is the result of bad data analysis
USDOT counted fewer trips in 2022, because it used a different, and less reliable survey method
USDOT’s social media created a false perception that 2022 data were comparable with earlier years
For all the time we spend talking about transportation, it’s surprising how little good data we have. The Census Bureau asks a narrow set of questions about our daily journey to work as part of its annual American Community Survey, but this misses the vast majority of travel that is neither to or from a workplace.
The US Department of Transportation commissions a periodic “National Household Travel Survey” to as a richer and more detailed set of questions about all kinds of travel. The NHTS serves as a vital benchmark for understanding travel patterns.
Completed in 2022, this latest survey seems well positioned to help us answer the question of how the Covid-19 pandemic changed our travel patterns. Last week, US DOT tweeted out an infographic offering a key finding from the latest NHTS.
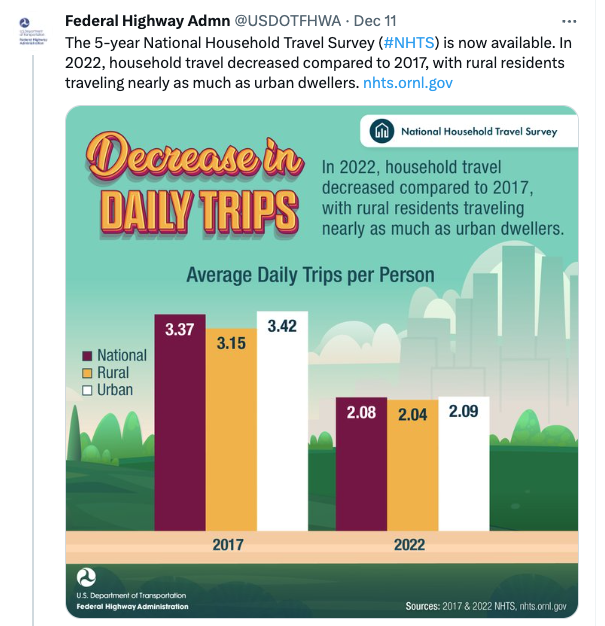
The graphic seems to show a dramatic—even catastrophic—decline in trip making. The headline is “Decrease in DAILY TRIPS”. the explanatory text offers “In 2022, household travel decreased compared to 2017.” The table reports trips fell from 3.4 per person per day, to barely 2 per day.
Big, if true. The message “decrease in trips” is clearly the take that active transportation blogger Angie Schmitt got from the data, repeating the top-line number from the graphic, and then musing over our growing isolation, in a Substack essay entitled “Nobody’s leaving the house anymore.”
In 2017, Americans used to average more than three trips a day. Going to work and back and then going somewhere else — that’s three trips. And also maybe they went to the store every other day, or a friend’s house. Now, people are taking just a little over 2 trips a day. . . .
As I said, I find this stunning. And let me explain a little more why. This is a HUGE HUGE change in the way people live their lives and their daily activity. I have been involved in sustainable transportation advocacy for over a decade, and the kinds of changes we try to implement — I cannot imagine it having an impact on this scale this quickly.
But Angie was right to describe this kind of change as unimaginable. Upon closer inspection, the supposed decline in trip-making is likely an illusion from bad data (or, more precisely, bad data inferences).
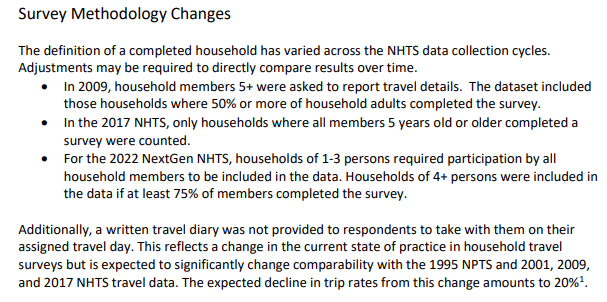
There’s a problem with the data. Between 2017 and 2022, the US DOT made some major changes to its data gathering methodology for the NHTS. First, it shifted to a primarily on-line data gathering method. Earlier surveys relied more on in-person interviews. Second, and more importantly, the survey eliminated the “travel diary.” Earlier versions of the NHTS sent participants a travel diary, in which to contemporaneously record their travel. The 2022 online survey doesn’t include a diary, and relies on the recollection of participants.
As the technical notes to the study (which appear on the website of the Oakridge National Laboratory, which conducted the survey for USDOT) reveal, this change almost certainly accounts for much (and perhaps all) of the decline in reported trip-making. Examining the results of earlier surveys, USDOT concluded that relying solely on recollection (as opposed to contemporaneous diaries) left out about 20 percent of all trips.
To be sure, it may well be that trip-making now is different (and lower) than it was pre-pandemic. It;s just that you can’t use this data to make any reliable statements about the direction or size of the change because the methodologies are substantially different from year to year.

In Raiders of the Lost Ark, Salah snatched a poisoned date from the air just before Indiana Jones swallowed it, exclaiming “Bad dates”. Unfortunately, we weren’t able to snatch this bad data before it got swallowed.
The critical takeaway for any user of this NHTS data has to be that it you simply can’t compare the 2017 trip-making data with the 2022 trip making data. This shouldn’t be an obscure footnote: it should be a cigarette-pack warning. But, with its cute-infographic, the USDOT did exactly the opposite. Its tweet approvingly presents the two data sets as directly comparable. Thanks to this misinformation, we are running into the “BS-Asymmetry” problem: it takes almost no effort to use social media to create a false (but interesting) finding, and vastly more effort to correct the error. We hope that US DOT will take steps to correct this mistaken impression.
If it were true that overall trip-making had fallen by about a third, that would have profound implications for the transportation system. It would, for example, call into question almost every expenditure to expand highway capacity. Its a shame that the NHTS data are presented in such a sloppy and inaccurate way, by of all entities, the US Department of Transportation.
None of this is to say that the National Household Travel Survey is useless. The key point here is that 2022 data can’t be directly compared with earlier data to make plausible assertions about changing travel patterns. It turns out that’s one of the big issues that we want to know about–because it definitely appears that the pandemic and the advent of work-from-home has produced some fundamental changes in travel patterns.
