Conflicting data sources present very different pictures of young adult migration rates
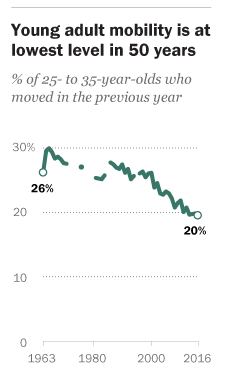
The Pew Research Center presented an analysis of census data reporting that today’s young adults are less likely to move in a given year than were their predecessors. A new article from Pew concludes: “Americans are moving at historically low rates, in part because Millennials are staying put.” Only about 20 percent of 25-35 year olds moved in the previous year, a rate far lower than the 26 percent of GenXers who moved when they were the same age and 27 percent of late boomers, who moved when they were in this age group.
The data for this finding come from the Census Bureau’s Current Population Survey, which each March asks a battery of detailed demographic questions, in what’s called the Annual Social and Economic Supplement (ASEC).
The Census Bureau also asks a nearly identical question as part of its ongoing American Community Survey. And, as we’ll see in a minute, the ACS presents a very different picture of migration trends for young adults than presented by the CPS. There are a couple of important differences between the two surveys: the ACS is much larger (about 3 million sampled households, as opposed to about 100,000 in the CPS). The CPS uses a slightly different sampling strategy (it includes only non-institutional households), and is administered solely via telephone. The CPS is superior for long-run research because it goes back to the 1960s; the ACS has been gathered only since 2001.
There’s little question that overall migration rates have declined in the US in the past several decades. There’s a good body of research exploring the reasons for this. Some of them have to do with an aging population (older people are less likely to move). Others have conjectured that declining migration is associated with growing occupational homogeneity among different regions (meaning there’s little reason to migrate to a different region for employment). We reviewed much of this literature in our report on the Young and Restless.
Others have identified some concerns using CPS data to chart migration patterns of young adults. The University of Virginia’s Luke Juday pointed out that CPS tended to significantly undercount the migration of young adults–“Migration data miscounts millennials, confuses the media.” Juday reports a discrepancy of more than a million migrants between CPS estimates of city-suburb migration and Census population estimates. Looking specifically at the question of interstate migration, in a 2011 article entitled “A Sharp Drop in Interstate Migration? Not really,” of the Federal Reserve Bank of Minneapolis found that imputation procedures used in processing CPS sample data tended to inflate the estimated numbers of interstate migrants (they also found that this particular problem didn’t affect the overall estimate of migration rates).
Given this track record of problems with the ACS data, it probably makes sense to double-check Pew’s findings with a second source of data, which we can do with the American Community Survey. We downloaded data from the University of Minnesota’s Integrated Public Use Microdata Series (IPUMS), for both the CPS, and the ACS. (See full citations below). For each data source, we computed the percentage of 25 to 35 year old respondents in each year who reported living in a different home than they did in the previous year.
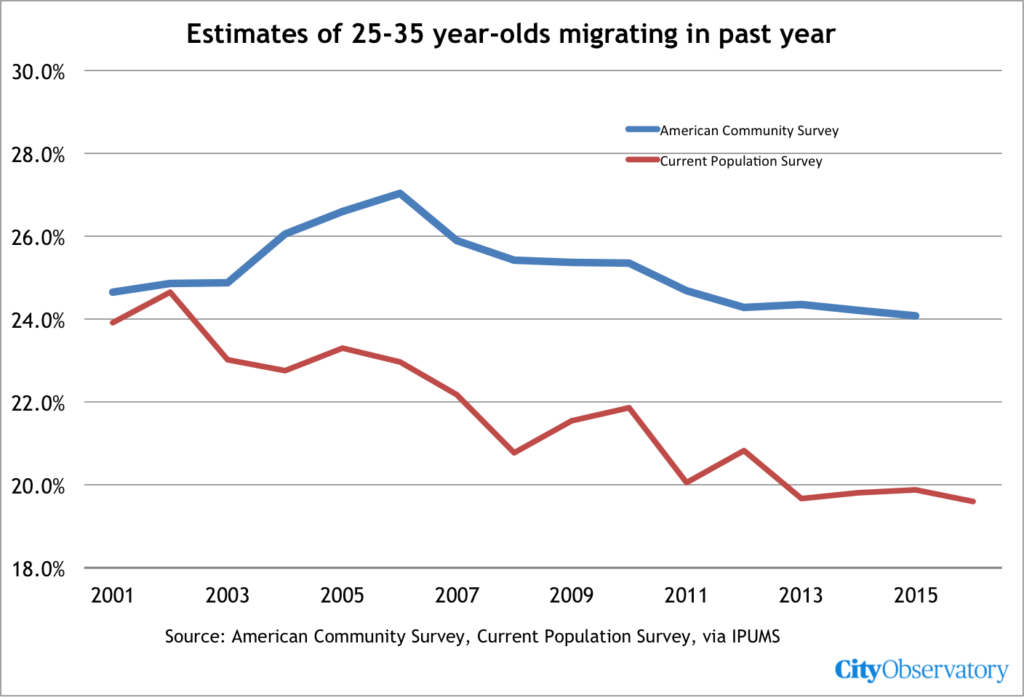
The CPS data (red) show the migration rates declining fairly steadily from about 24 percent in 2001 to less than 20 percent in 2016–mirroring the findings reported in the Pew report. While the ACS estimates of 25-35 year old migration rates are remarkably similar (within about half a percentage point) in 2001 and 2002, they diverge substantially thereafter. The ACS estimates suggest that migration rates for young adults rose from 2001 through 2006, peaking about the same time as the housing bubble, and then declining somewhat thereafter. The 2015 ACS 1 year migration estimate for 25 to 35 year olds (24.1 percent) is within about one-half percentage point of its 2001 level (24.6 percent).
These two series paint very different pictures, especially on the effect of the housing market on migration rates. If one believes the Pew/CPS story, the housing bubble had essentially no effect on the long term trend in migration rates; the likelihood that a young adult moved declined even as the housing market was super-heated–and rates kept on declining through 2013. In contrast, the story in the ACS data is that at least temporarily, at a time coincident with the housing bubble, the rate of migration for 25-35 year olds surged, and then started declining after the bubble collapsed.
We don’t have a definitive means of choosing one of these data series and its attendant explanations over the others. Given the larger sample size of the ACS, and its freedom from some of the doubts that have arisen about other uses of the CPS for migration studies, we’re inclined to put more weight on the ACS. It also seems plausible to us that the housing bubble and its attendant collapse would produce the kind of “surge and purge” pattern seen in the ACS data. But in the end, we may have to defer to the Magic 8-ball for our answer:

References
Steven Ruggles, Katie Genadek, Ronald Goeken, Josiah Grover, and Matthew Sobek. Integrated Public Use Microdata Series: Version 6.0 [dataset]. Minneapolis: University of Minnesota, 2015. http://doi.org/10.18128/D010.V6.0.
Sarah Flood, Miriam King, Steven Ruggles, and J. Robert Warren. Integrated Public Use Microdata Series, Current Population Survey: Version 4.0. [dataset]. Minneapolis: University of Minnesota, 2015. http://doi.org/10.18128/D030.V4.0.
This post was revised to correct a mis-statement about the differences in the sampling universes of the two surveys.
