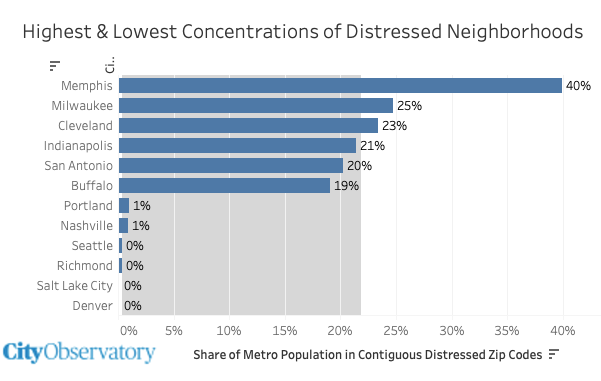
There’s a yawning chasm of neighborhood level economic distress across US metro areas. While about 1 in 6 US neighborhoods is classed as distressed, some metro areas have large concentrations of distress, while others have almost no distressed neighborhoods at all. Focusing on groups of contiguous zip codes classified as “distressed” shows that in some metros 20 percent or more of the population lives in a distressed zip code that is part of a cluster of distress, while in other metro’s less than 1 percent of the region’s population live in such distressed clusters. Here are the six large metro areas with the largest and smallest shares of their metro area population living in a cluster of distressed zip codes:
In short, the problem of concentrated neighborhood distress appears to be an order of magnitude greater in some metro areas than others. The problem of persistent, concentrated poverty continues to plague some large metropolitan areas, while others have a geography of much more evenly distributed economic well-being.
These insights are based on data from a new report from the Economic Innovation Group which illustrates the widely varying patterns of neighborhood distress across the nation. EIG’s uses a series of seven indicators, including job growth, educational attainment, poverty, housing, income, unemployment and business growth to rank states, counties, cities and zip codes as either distressed, at-risk, comfortable or prosperous. Viewed at its finest resolution, zip codes, the index provides a fascinating mosaic of varied economic conditions.
Overall, 52 million Americans—about 16 percent of the population—live in a zip code that is classified as distressed.
Of these 12.8 million people, about a quarter of the people living in a distressed zip code in the United States live in a zip code that is contiguous to other distressed zip codes in one of the nation’s largest metro areas.
Concentrations of distressed zip codes are disproportionately located in relatively few large metropolitan areas. Many large metropolitan areas have less than 2 percent of their population living in contiguous distressed zip codes.
Looking past the bewildering jigsaw puzzle.
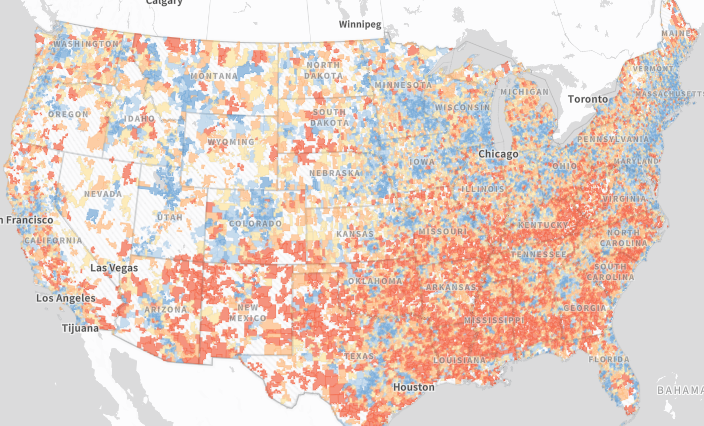
Viewed at a national level, zip code data looks like a challenging jigsaw puzzle. The one pattern that emerges consistently is the profoundly rural and regional character of zip code level distress. Most distressed places are rural, rather than metropolitan, and the entire southern part of the country, from New Mexico to the Atlantic is dominated by rural distressed zip codes. Metro areas, in contrast, tend to be prosperous or comfortable, and the metropolitan, and bi-coastal character of prosperity is apparent if you look closely.
Where are distressed neighborhoods concentrated?
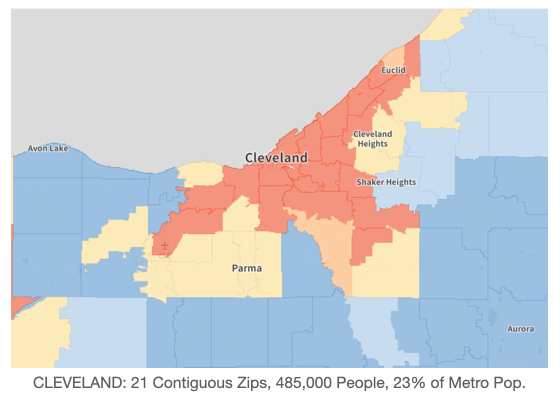
A critical question is how is prosperity distributed within metro areas. The great value of the EIG website is you can quickly zoom into a map of a particular metropolitan area and see the geography of distress and poverty. Looking closely at the pattern of zip codes, some striking patterns emerge. In most large metros, distressed zip codes tend to be found in the center of the region, and most distressed zip codes are contiguous—that is, there are clusters of distressed neighborhoods. Some metro areas have large numbers of distressed neighborhoods clustered in their cores, others have far fewer. Here are maps of several metropolitan areas, with zip codes colored dark red classified as “distressed.” First, Cleveland, a long-suffering rust-belt city has one of the largest clusters of distressed neighborhoods, which dominate most of its central zip codes. Nearly 500,000 people live in this contiguous group of 21 zip codes, about 23 percent of the metropolitan area population.
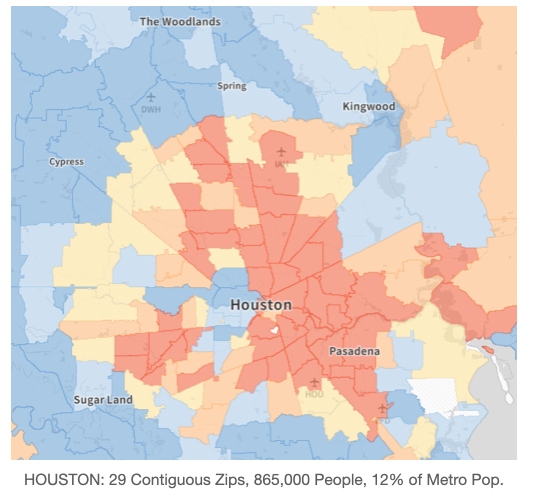
Distressed neighborhoods also occur in growing sunbelt metros as well, as this map of Houston makes clear. Much of the region’s east side is neighborhoods that are classified as distressed. About 12 percent of Houston’s metro population, roughly 865,000 people live in this group of 29 contiguous “distressed” zip codes. (Note that we don’t count a second, smaller separate cluster of distressed zip codes on the city’s southwest side).
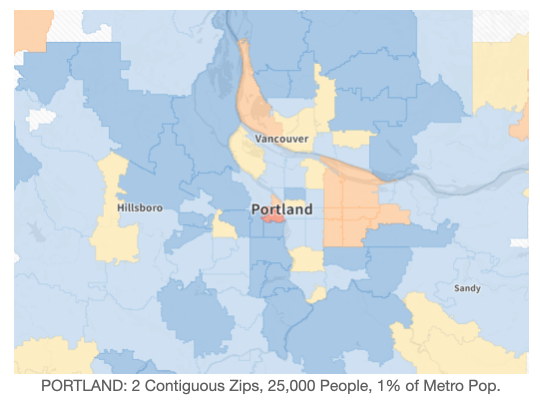
Some metro areas have few or isolated pockets of distressed zip codes, according to the EIG metrics. The Denver and Salt Lake City metro areas have no distressed zip codes, per EIG. The Portland metropolitan area has two distressed zip codes, with the most of the rest of the region classified as comfortable or prosperous.
Which metro areas have the most concentrated neighborhood distress?
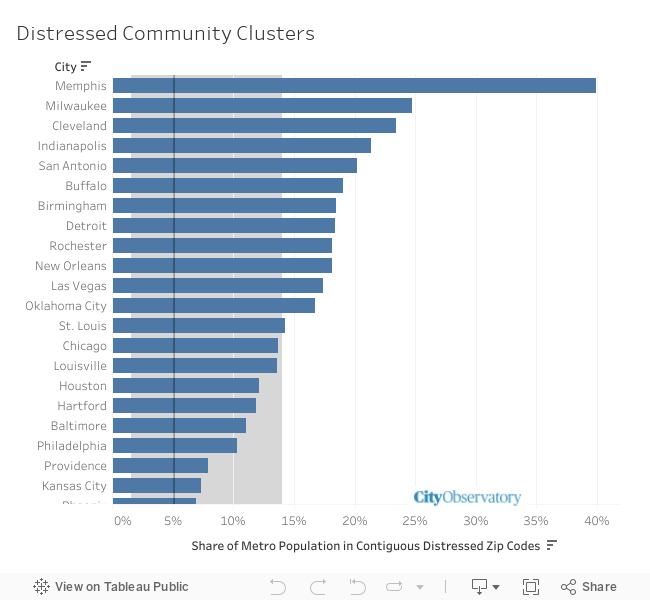
To look at this more systematically, we counted the number of contiguous, distressed zip codes in each of the nation’s largest metro areas. For each metro, we computed the number of people living in these distressed zip codes, and the total share of the metro area population living in one of those contiguous distressed zip codes. Overall, 12.8 million people, about a quarter of the people living in a distressed zip code in the United States live in a zip code that is contiguous to other distressed zip codes in one of the nation’s largest metro areas.
Among metropolitan areas with a million or more population, the median metropolitan area has about 5 percent of its population living in its largest cluster of distressed zip codes. But there’s very wide variation across metropolitan areas. Memphis and Cleveland, for example, have more than five times as large a share of their metro populations living in a cluster of concentrated distress. In contrast, the bottom quartile of all metro areas have fewer than 2 percent of their regional populations living in clusters of zip codes experiencing distress.
A national picture of concentrated neighborhood distress. We’ve taken the same data shown in the figure above, and presented it in mapped form to show the pattern of variation in concentrated neighborhood distress across U.S. metropolitan areas. In this map, the size of each circle corresponds to the number of persons living in contiguous distressed zip codes in each metropolitan area; the color of each circle corresponds to the share of the region’s population living in contiguous distressed zip codes (with green being fewest, and yellow/red most). Mousing over the map symbols shows the number of zip codes in each contiguous cluster, and the number of persons and share of the metropolitan population living in each cluster.
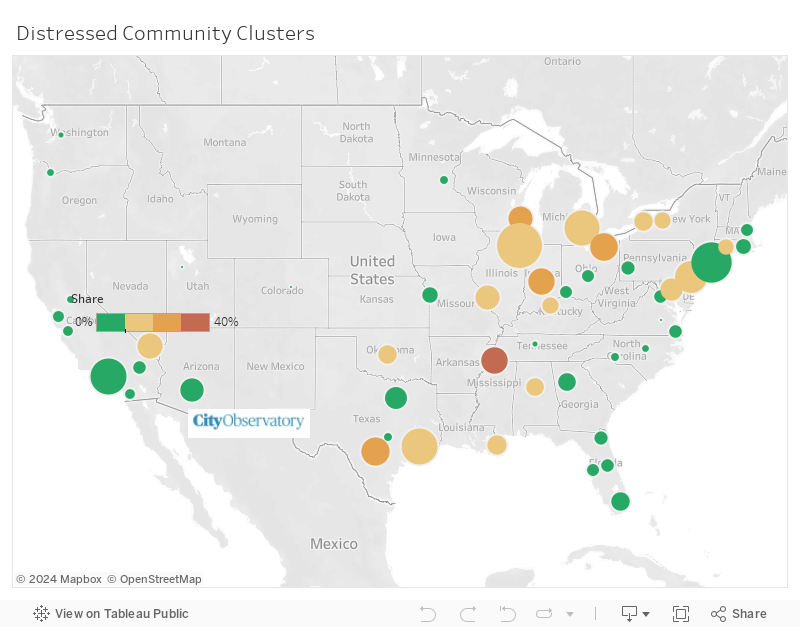
There are clear geographic patterns here: Rustbelt cities tend to have much larger shares of their population living in contiguous distressed zip codes. Most Western metro’s have relatively small shares of their population living in such neighborhoods. The pattern in the US South is varied. And many fast-growing metros have higher proportions of concentrated distressed zip codes: Oklahoma City, Houston, Las Vegas and San Antonio all have two to three times as large a share of their population living in contiguous distressed zip codes than in the median large metropolitan area.
There are strong reasons to focus on these clusters: There’s a powerful body of evidence that concentrated poverty–living in a neighborhood where a high fraction of your neighbors are poor, has more devastating effects. A single, isolated zip code that gets classified as “distressed” is a far less intractable problem than a contiguous cluster of 10 or 20 such zip codes.
About the EIG Distressed Communities Index
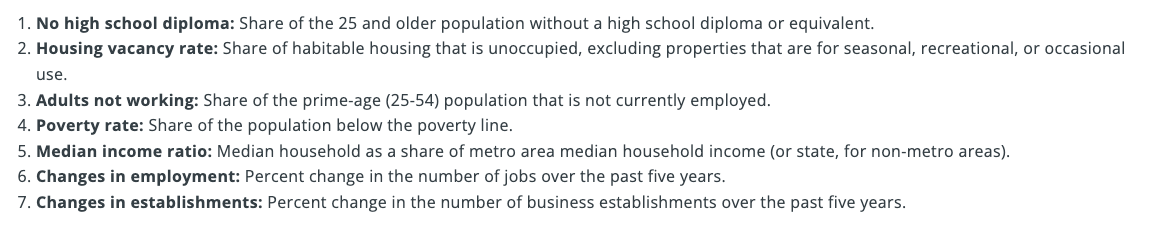
The methodology of the EIG Index is explained on its website. The index consists of seven different indicators, which represent a mix of socio-economic and housing indicators.
Our thanks to EIG for publishing their zip code level maps in a publicly accessible format. The conclusions presented in this commentary are those of City Observatory, and not necessarily EIG.
