What City Observatory Did This Week
ODOT’s real financial problem isn’t revenue. ODOT’s financial crisis isn’t a result of falling revenue, instead it has been caused by massive cost overruns on highway expansion megaprojects, extravagant funding for consultants, and no effective management oversight despite persistent problems, all compounded by increased debt.
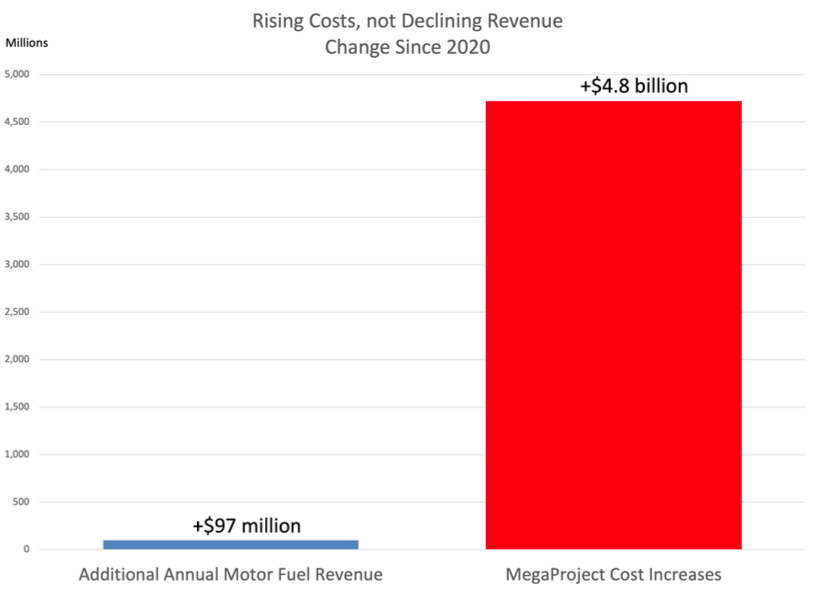
Over the past five years, ODOT motor fuel tax revenue has actually increased by about $97 million per year, but megaproject costs have increased vastly more, by about $4.7 billion. The cost overruns, aren’t new; they’ve been going on for two decades, and have grown vastly worse in the past few years. It’s a management axiom that you get the behavior you reward, and Oregon Transportation Commission, which oversees ODOT, has simply shrugged, smiled and paid the ever increasing costs of poorly managed projects. Little wonder than they are seeing more and more cost overruns: Their staff and contractors have learned to low-ball initial estimates, to disregard risks, and rely on the commission to bail them out down the road. Its a recipe for continuing financial disaster.
Must Read

- Talk does not equal action
- Fear of conflict is paralyzing
- Prioritize your priorities
As advocates scramble to hang on to what few crumbs federal funding providing for bike, pedestrian, safety and community healing, they would be well advised to keep in mind Rall’s advice in future planning.
By the end of annexations as we knew them, Memphis’ land area was bigger than Pittsburgh, Cleveland, Cincinnati, and Atlanta – combined. And in the process, more than 170,000 Memphians had moved out of 1970 Memphis into the green pastures incentivized by county funding. . . . The result of this historic movement of people in the Memphis region has been multi-dimensional but the issues that were challenges in 1970 became more intense and entrenched as a result of decades of sprawl. Most of all, in study after study, Memphis was among the cities with the most economic segregation…and sprawl exacerbated the issue because of disinvestment in urban neighborhoods, blocked the inability to bring promising programs for our children to scale . . .
The continuing myth of a “user pays transportation system. David Cooke of the Union of Concerned Scientists offers us a reminder that the notion that we have a “user pays” system of transportation is a pernicious myth. The “user pays” myth has two important dimensions. First, it implies that drivers have actually paid the full cost of building the road system (they haven’t, at local, state and federal levels, a large and increasing share of the direct costs of building and maintaining roads gets paid out of non-transportation revenues). A second, corolary dimension is the idea that all revenue raised from driving must be spent on raods. As xxx argues:
. . . the myth that roads pay for themselves perpetuates the lie that revenue generated from driving on roads must be spent on roads. We need to acknowledge the truth behind the public investment in our transportation system to ensure that it is working for the entire public, not just the driving public. Not everyone can or desires to drive—we need to invest in a system that will provide mobility options for all.
And in reality, “user pays” typically only counts the initial and direct costs of the transportation system and almost entirely ignores all of the indirect environmental, social and economic costs associated with a car dependent transportation system. As a practical matter than means that even large vehicles that pay high levels of taxes are 18-wheel welfare cadillacs because they draw billions in subsidies from other sources.
New Knowledge
Cost drivers in road building: competence and competitition. The Brookings Institution recently published a comprehensive study of cost variations among state highway departments. According to the report, the biggest factors driving excessive costs nationally were limited state staff expertise and excessive reliance on consultants, and a lack of competition and failure to seek out qualified bidders for projects. The report examines the variations among states in road maintenance costs, and analyze how these relate to differences in state policies and practices for procurement. There is wide variation among states in costs.
x
The study concluded that the level of competition and the expertise of state staff played were strongly correlated with average costs of road maintenance.
Two themes arise from our study of DOT highway procurement. First is the role of competition as a cost driver. This is evident from the survey and the administrative data—bidders know the identity and capacity of their competitors at the time of the bid-letting, DOTs do very little bidder outreach, and there are fewer construction firms in most states than there were 10 years ago. Further, the number of bidders, and the DOT propensity to do outreach, correlate with lower realized costs. The second theme is the role of DOT capacity as a cost driver. We find that DOTs that provide more details at the time of the bid-letting have lower costs, while states with more change orders, which are often the result of poor planning, have higher costs.
This has important practical implicaitons. For example, it found that Oregon costs were almost double the national average for common road repairs. According to the Brookings Study, Oregon’s average cost of resurfacing a lane-mile of road is about $600,000 (Table B-6) which is more than double the $226,000 median state expenditure. Oregon is among the ten most costly states for this road maintenance measure.
Zachary Liscow, Will Nober and Cailin Slattery, Procurement and Infrastructure, July 11, 2024, Brookings Institution. https://www.brookings.edu/wp-content/uploads/2024/05/Procurement_and_Infrastructure_Costs.pdf
Follow City Observatory on Bluesky.