Back in July, we published a three–part series about what exactly it means for housing to be affordable. Our basic argument was that the most standard measurement—whether your housing costs are more or less than 30 percent of your income—is inadequate to the task, for several reasons:
- First, it doesn’t allow for lower-income people to need a larger percentage of their income for other necessities, or for people of the same income levels to have different financial obligations, like children or medical expenses;
- Second, it leaves out other location-based costs, like transportation;
- And finally, it doesn’t account for the quality of housing or the surrounding community.
Instead of the 30 percent threshold, we endorsed something called the “residual income” approach. That method suggests that you determine what a household needs to spend on all non-location-based (that is, housing and transportation) necessities, and then whatever’s left is “affordable.”
But what’s the difference in the real world? Well, an astute reader, Josh Lehner, put together a table that compares the ratio of rent to income and the residual of income left over after rent for each ZIP code in Oregon. Here’s what that looks like:
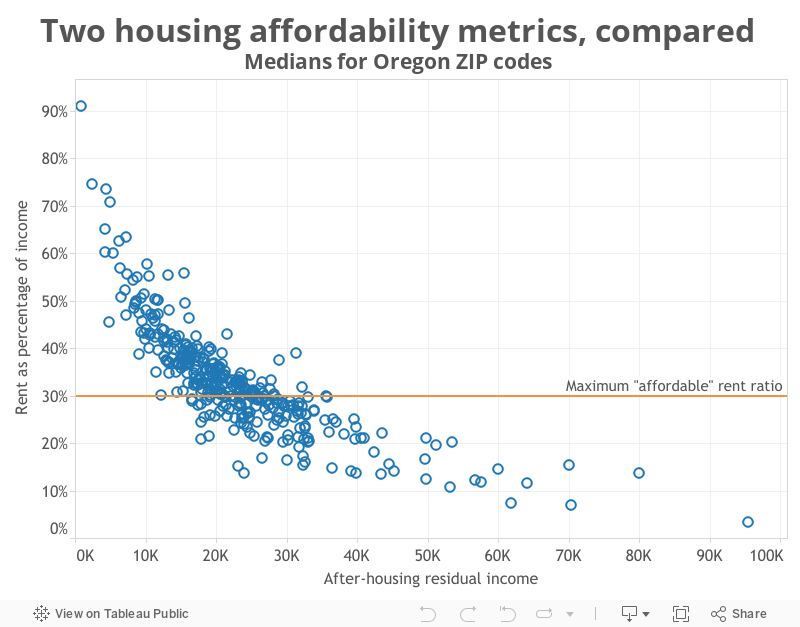
As you can see, there’s a clear relationship between the two measures: as the ratio increases, the residual mostly decreases, which in each case suggests that housing is less affordable. (Note that this chart doesn’t include transportation-based costs. Ideally, of course, it would—but for the purposes of this illustration, it’s not crucial.)
But despite that general pattern, there’s an enormous amount of wiggle room. If you look just above and below the line that separates ZIP codes where median income is below 30% of median rent from those where it is above, you see some of the starkest contrasts.
ZIP code 97630 (rural Lakeview Oregon), for example, is just below the threshold of affordability, with the rent-income ratio at 29.2 percent. But the median household in that area makes only $23,500 a year; at the median rent, they would have just $16,636 left over to spend on everything else: food, clothing, medical care, child care, and so on. For many households, that’s likely not enough.
Meanwhile, ZIP code 97002 (Aurora, a small farming town within commuting distance of Portland and Salem) is just above the threshold of affordability, with a rent-income ratio of 31.8 percent. In this community, median household income is $47,173, and the after-rent residual income is $32,173—a much more comfortable cushion. Yet the most common measurement of housing affordability would declare the median resident of ZIP code 97002 “rent burdened,” and the median resident of ZIP code 97630 not “rent burdened.”
Obviously, this is a very simplistic exercise that’s missing quite a bit—including many of the considerations we included in our original series. But even the simple act of plotting rent cost ratios against residuals adds an important dimension (if you’ll excuse the graph pun) to our understanding of what housing affordability actually means: we can see, not with theoretical arguments but real-life data, that simply knowing whether a rent cost ratio is above or below 30 percent leaves out a lot of other very important information.
This post was originally published on September 3rd, 2015.
