A new report confirms the growing market for walkable places
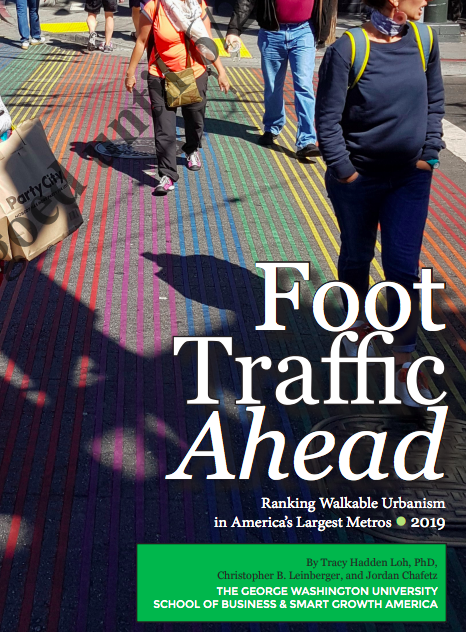
George Washington University and Smart Growth America have a new report on the economic value of and growing market for walkable places. Called “Foot Traffic Ahead–2019” this latest report is an update of research done originally in 2007 and published by the Brookings Institution and an earlier version of “Foot Traffic Ahead, published in 2016.
The key takeaway from the report is that more walkable places command a price premium over less walkable ones, and that premium has increased in recent years. The report concludes that income property like office, commercial spaces and apartments in walkable areas are valued about 75 percent higher than non-walkable properties, and that walkable residential properties are valued about 95 percent higher.
The report tabulates the “Walkable Urban Places” in the the nation’s 30 largest metro areas, using its own proprietary definition of walkable areas: they are places that contain at least 1.3 million square feet of office space or 300,000 square feet of retail space and for which the most walkable residential location in the area has a WalkScore of at least 70.
The requirements for more than a million square feet of leasable office space or 300,000 square feet of retail space tend to automatically exclude neighborhood level. While such metrics may be of great interest to larger scale investors and developers, they no doubt leave out highly walkable neighborhoods that aren’t regionally significant office or retail centers. Plus, as the report notes, these office space estimates include only leased space, not owner occupied offices and most public office space (which often contributes a critical mass of employment density to walkable locations).
No maps
While the report has abundant pictures of walkable urban locations, and makes references to a few specific places in its report (including the 10 most social equitable walkable places, nine of which are in New York City), it doesn’t contain any maps that illustrate or document the number, location and boundaries of identified walkable neighborhoods. That means as a reader, you are left to guess which places in any city that the authors have classified as walkable (or not). This is an unfortunate omission, because walkability has such a strong visual and intuitive component, and connecting the definitions in the report to the lived experience with which readers are likely familiar would make it both more persuasive and useful.
As we’ve mentioned many times before in the debates about the best ways to measure walkability, one of the most important criteria is transparency: can readers or users easily see which places are classified as walkable, and why. It’s one of the reasons we’re so enamored of the Walk Score metric. Anyone, using an internet browser, can look of the Walk Score for any address in the US, and, just as importantly, see what criteria and which nearby destinations were used to compute its walkability. Inevitably, rating walkability is a complex and often judgmental task, and errors sometimes creep in to the best methods: transparently showing one’s work with math is the best way to assure that the results are valid and trustworthy.
Centrality and walkability
As we all know, there are lots of factors that figure into the value of a square foot of urban property. Our work, and research by Zillow, has shown that there’s a statistically significant contribution of Walk Score to home values. The preferred way of assessing the contribution of walkability is to control for other known factors that are likely to influence property values, including the size of the property, its age, the number of bedrooms and bathrooms, the size of yards, the presence of amenities (fireplaces, swimming pools) and the characteristics of the neighborhood (income, schools, crime, etc).
In general, we find that walkability is often highly correlated with centrality. Centrally located neighborhoods, in downtowns and in older urban areas, tend to have higher density, a greater mix of different uses, and a better connected street grid than newer lower density, use-segregated suburban areas. In calculating the value of walkability its important to separate out the effects of centrality (proxied by distance to the central business district) from other walkable features. (You can make an area more walkable in many ways, but you can’t move it closer to the CBD).
Going forward
The case for the value of walkability is now clearly established. The key to moving markets and re-framing policy is to make walkability information even more fine-grained and accessible than it is currently, and to be able to parse out the separate effects of centrality (which are hard or impossible to change) and walkability itself. The next big research tasks in the walkability field are likely to be to see if we can’t disentangle the various aspects of place, density and the built environment that contribute to walkability generally, and which drive value.
Valuing Walkability
A new report confirms the growing market for walkable places
George Washington University and Smart Growth America have a new report on the economic value of and growing market for walkable places. Called “Foot Traffic Ahead–2019” this latest report is an update of research done originally in 2007 and published by the Brookings Institution and an earlier version of “Foot Traffic Ahead, published in 2016.
The key takeaway from the report is that more walkable places command a price premium over less walkable ones, and that premium has increased in recent years. The report concludes that income property like office, commercial spaces and apartments in walkable areas are valued about 75 percent higher than non-walkable properties, and that walkable residential properties are valued about 95 percent higher.
The report tabulates the “Walkable Urban Places” in the the nation’s 30 largest metro areas, using its own proprietary definition of walkable areas: they are places that contain at least 1.3 million square feet of office space or 300,000 square feet of retail space and for which the most walkable residential location in the area has a WalkScore of at least 70.
The requirements for more than a million square feet of leasable office space or 300,000 square feet of retail space tend to automatically exclude neighborhood level. While such metrics may be of great interest to larger scale investors and developers, they no doubt leave out highly walkable neighborhoods that aren’t regionally significant office or retail centers. Plus, as the report notes, these office space estimates include only leased space, not owner occupied offices and most public office space (which often contributes a critical mass of employment density to walkable locations).
No maps
While the report has abundant pictures of walkable urban locations, and makes references to a few specific places in its report (including the 10 most social equitable walkable places, nine of which are in New York City), it doesn’t contain any maps that illustrate or document the number, location and boundaries of identified walkable neighborhoods. That means as a reader, you are left to guess which places in any city that the authors have classified as walkable (or not). This is an unfortunate omission, because walkability has such a strong visual and intuitive component, and connecting the definitions in the report to the lived experience with which readers are likely familiar would make it both more persuasive and useful.
As we’ve mentioned many times before in the debates about the best ways to measure walkability, one of the most important criteria is transparency: can readers or users easily see which places are classified as walkable, and why. It’s one of the reasons we’re so enamored of the Walk Score metric. Anyone, using an internet browser, can look of the Walk Score for any address in the US, and, just as importantly, see what criteria and which nearby destinations were used to compute its walkability. Inevitably, rating walkability is a complex and often judgmental task, and errors sometimes creep in to the best methods: transparently showing one’s work with math is the best way to assure that the results are valid and trustworthy.
Centrality and walkability
As we all know, there are lots of factors that figure into the value of a square foot of urban property. Our work, and research by Zillow, has shown that there’s a statistically significant contribution of Walk Score to home values. The preferred way of assessing the contribution of walkability is to control for other known factors that are likely to influence property values, including the size of the property, its age, the number of bedrooms and bathrooms, the size of yards, the presence of amenities (fireplaces, swimming pools) and the characteristics of the neighborhood (income, schools, crime, etc).
In general, we find that walkability is often highly correlated with centrality. Centrally located neighborhoods, in downtowns and in older urban areas, tend to have higher density, a greater mix of different uses, and a better connected street grid than newer lower density, use-segregated suburban areas. In calculating the value of walkability its important to separate out the effects of centrality (proxied by distance to the central business district) from other walkable features. (You can make an area more walkable in many ways, but you can’t move it closer to the CBD).
Going forward
The case for the value of walkability is now clearly established. The key to moving markets and re-framing policy is to make walkability information even more fine-grained and accessible than it is currently, and to be able to parse out the separate effects of centrality (which are hard or impossible to change) and walkability itself. The next big research tasks in the walkability field are likely to be to see if we can’t disentangle the various aspects of place, density and the built environment that contribute to walkability generally, and which drive value.
Related Commentary