As chronicled in our report here and commentary here, we are seeing evidence of a shift in employment back to city centers. We believe that this is driven by a number of forces, including the increasing preference of young, talented workers for urban living; some of this shift is cyclical and coincides with the fact that more decentralized industries (construction, warehousing) bore a greater brunt of the pain of the Great Recession. Some of the success has to do with cities gaining competitive advantages over their peripheral counterparts. Regardless of the causes, we are seeing that from 2007-11, aggregate performance of city centers was better than that of their more decentralized peripheries.
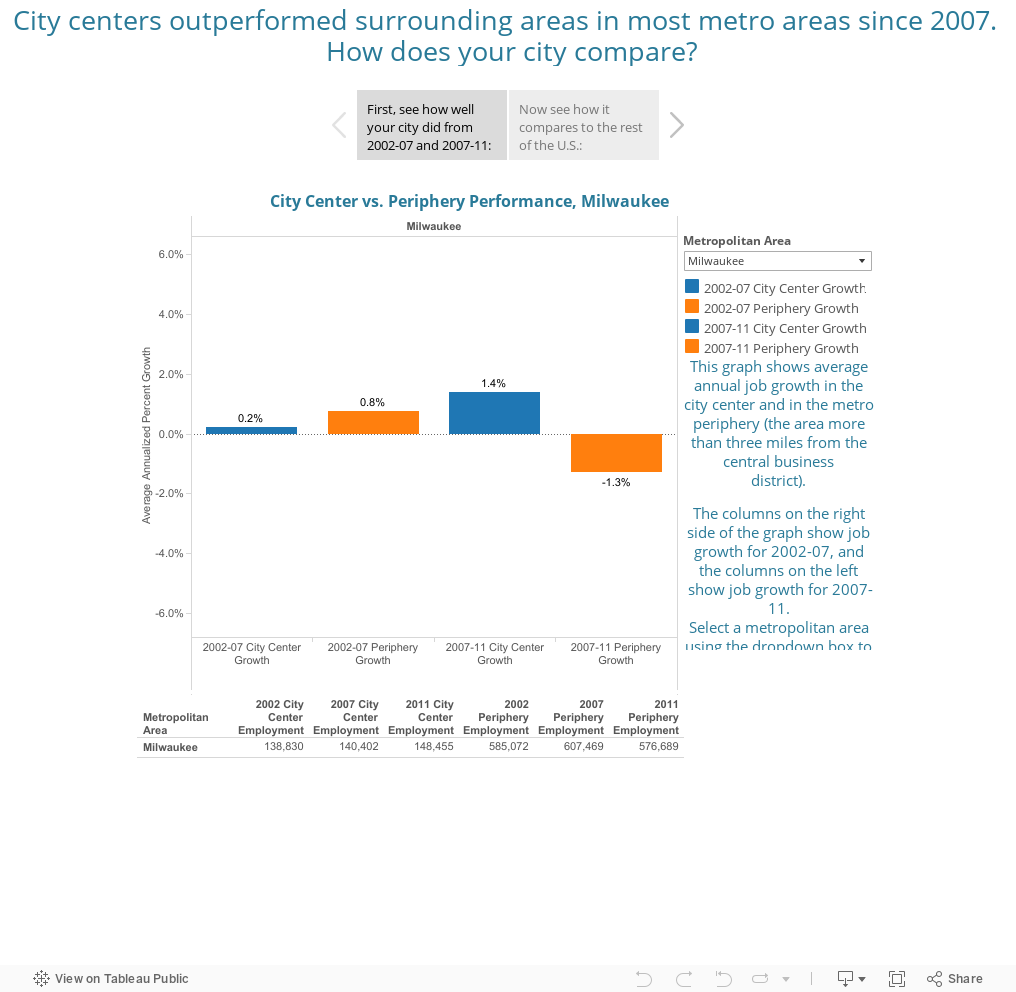
Still, there are always outliers– as well as cities that exemplify the trend– so we thought we’d present the following dashboard displaying results for individual metros. It shows the annual growth of employment in the city center (a 3 mile radius from the center of the central business district), as well as in the periphery (defined as the area outside the 3-mile radius). Data are for two time periods: 2002-07 and 2007-11. Use the dropdown menu to select a metropolitan area.
Our dashboard also allows you to compare, side-by-side, the performance of a selected metro area with the aggregate performance of the 41 metropolitan areas included in our study. To see this comparative summary, select the right-hand tab at the top of the dashboard.
