Much of the conversation about urban inequality today—from Raj Chetty’s work on intergenerational economic mobility, to issues of concentrated poverty and gentrification—is framed in terms of economic segregation. But it turns out that “economic segregation” isn’t just one thing, and what we mean by the phrase, and how we choose to measure it, has serious implications both for our understanding of urban inequality and the kinds of policies we might design to fix it.
The basic issue is that unlike racial segregation, which has a few (ostensibly) discrete categories into which people fall, income segregation has to divide people based on a continuous spectrum with no obvious objective cutoffs, or even number of categories. Social scientists have come up with a number of different approaches to this problem; in this post, we’ll go through several of the most common and explain why they matter, with the goal of leaving you more able to engage in detailed, thoughtful conversations about inequality, segregation, and opportunity in your own city and beyond. (The examples will be based on work by Sean Riordan and Kendra Bischoff, whose papers on measuring economic segregation over the last several years have been excellent.)
High-income segregation
One approach is to measure how separate upper-income people are from everyone else. You might focus on this if you believe that, especially when the rich have a greater share of total income than they have in generations, what Robert Reich has called the “secession of the successful” threatens to keep an enormous share of society’s resources out of reach of everyone else. You can think of this as a sort of Mossack Fonseca problem: like offshoring wealth to avoid federal taxes, forming clusters of exclusive communities is a way of ensuring that money that might otherwise be used to pay for society-wide benefits will instead be spent disproportionately on the wealthy people themselves.
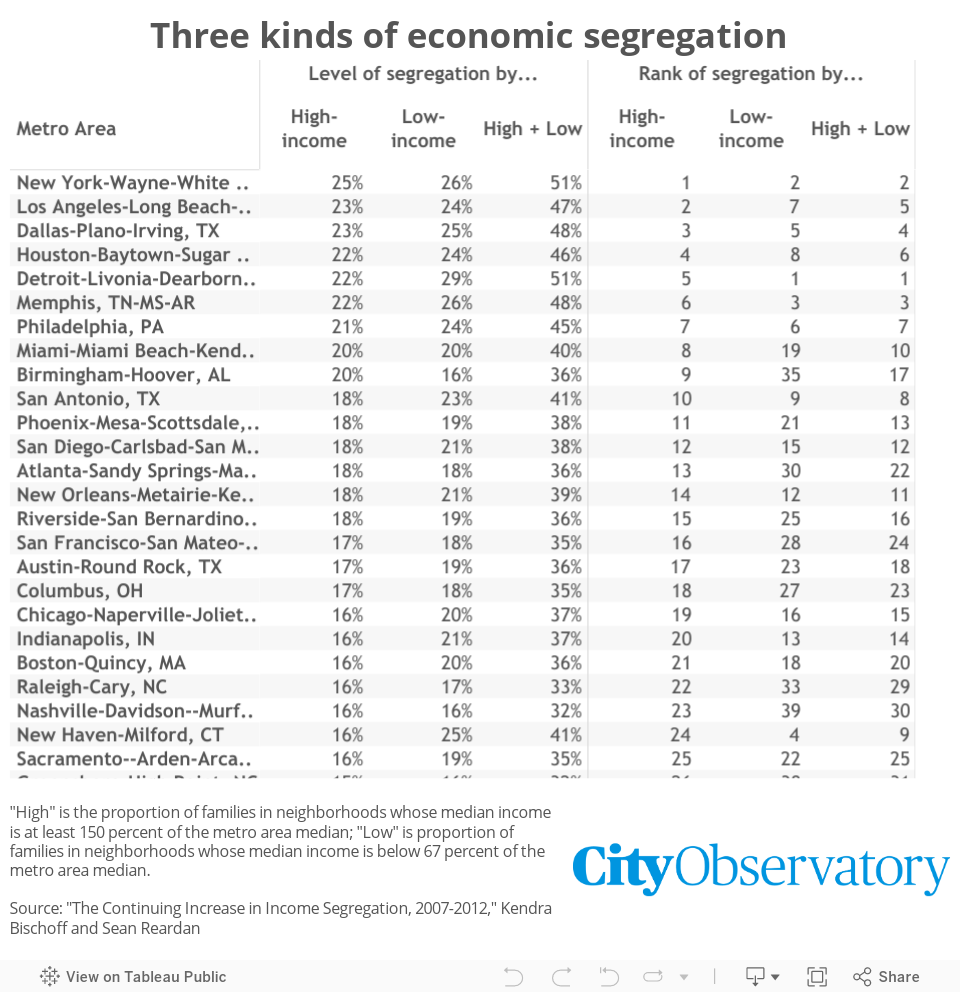
Riordan and Bischoff measure this by counting the proportion of people in a metropolitan area who live in neighborhoods where the median family income is more than 1.5 times higher than the median family income of the region as a whole. So, for example, the median family income in the Boston metro area is about $96,000 in the 2014 1-year American Community Survey; for that year, this measure would count the number of people living in neighborhoods where the median family income was at least $144,000. Because they use the median, and not the average, this will only capture neighborhoods where at least half of all families meet that threshold of disproportionate income; and because they measure families, it corrects for some of the differences between neighborhoods that result from age differences.
Low-income segregation
Another approach is to measure how separate low-income people are. You might focus on this version if you believe that the main threat from economic segregation is concentrated poverty; indeed, much of the research on economic segregation has focused on the problems associated with neighborhoods where a very large proportion of residents are low-income, including worse economic mobility, educational, and health outcomes.
Riordan and Bischoff’s measure for this mirrors their high-income segregation indicator: the proportion of people in a metropolitan area who live in a neighborhood where the median family income is at least 33 percent below the median income of the region as a whole. So, going back to Boston, this measure would count the number of people living in neighborhoods where the median family income is less than about $64,000.
High + Low
Perhaps you are interested in both of these aspects of economic segregation. An easy way to add them together is to…add them together. Another Riordan-Bischoff index is simply the proportion of people who live in high-income neighborhoods or low-income neighborhoods. This makes sense if you want to see how typical it is for someone to live in a community that is on some extreme, as opposed to being middle- or mixed-income. It makes for a good, quick, intuitive number that captures both high-end and low-end segregation.
On the other hand, it doesn’t necessarily tell you which of these is a problem, or in which proportions. Perhaps one city has a huge problem with concentrated poverty, while another’s issue is concentrated wealth. The policy response would not necessarily be the same to both.
How much of a difference does it make?
So how much do we gain by breaking down these different kinds of income segregation? Quite a bit, actually.
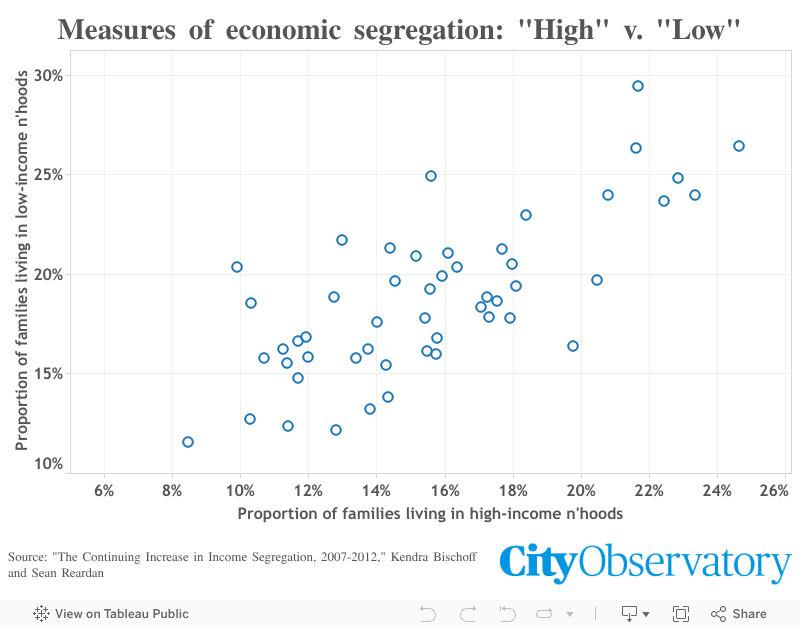
Comparing the prevalence of high-income and low-income neighborhoods by metro area, we can see quite a range of differences. In most cities, these numbers are roughly proportional. In Richmond, VA, 14 percent of families live in high-income neighborhoods, and 16 percent live in low-income neighborhoods. In San Diego, it’s 18 percent in high-income areas, and 21 percent in low-income areas. But in other cities, one side clearly dominates.
In some cities, many more people live in low-income neighborhoods than upper-income ones. In New Haven, for example, 16 percent of families live in high-income neighborhoods—but 25 percent live in low-income ones. In Milwaukee, it’s 13 percent and 22 percent; in Providence, it’s 10 percent and 20 percent. In these areas, concentrated poverty appears to be an even larger problem than in a typical metro area.
Interestingly, there really aren’t many cities where people in wealthy neighborhoods outnumber people in low-income neighborhoods. Partly, that reflects an argument we’ve been making for a while about the relative importance of the issues of gentrification by upper-income people and concentrated poverty. But it’s also, of course, a reflection of the income cutoffs chosen by Bischoff and Reardon. It might be useful if we had a fourth measurement—one that took into account the entire spectrum of income, and didn’t depend on arbitrary categorizations?
Tomorrow, we’ll introduce you to Bischoff and Reardon’s “H Index,” which does just that.
