What City Observatory did this week
1. Cities for Everyone: Our Birthday Wish. October 15 marked City Observatory’s second birthday. We reviewed some of the highlights of the past year, focusing on the growing evidence of the economic resurgence building around the nation’s cities. For the coming year, we’re planning on focusing on what it takes to build and maintain diverse inclusive communities: cities for everyone.

2. The Price of Parking. Using data from the website Parkme, we’ve constructed an index of typical monthly parking costs in the nation’s largest metropolitan areas. While the median price in large cities is around $200 per month, there’s huge variation. Prices range from more than $700 per month in New York to less than $30 monthly in Oklahoma City. See how your city’s parking prices compare to others.
3. Cities and the Price of Parking. Using our city parking price index, we look at the relationship between parking prices and transportation behavior in different metropolitan areas. Our analysis shows a strong correlation between parking prices and transit use: people are much more likely to take transit in cities with expensive parking. Parking prices also correlate closely to the penetration of ride-hailing businesses like Lyft and Uber. The population-adjusted number of transportation service non-employers (a proxy for ride sharing businesses) is highest in cities with the most expensive parking. Parking, as it turns out, is a surrogate form of road pricing, with parking charges discouraging peak period car trips to urban centers and shifting travel to other modes. The more widespread deployment of ride-hailing may transform the role that parking prices play.
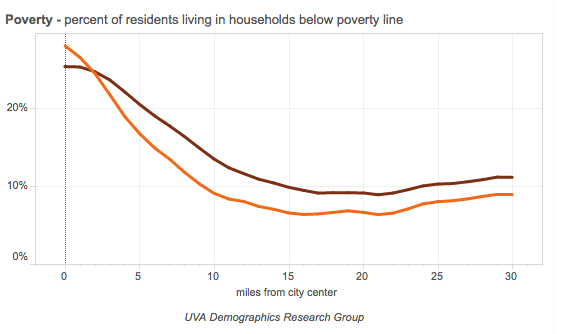
4. The Myth Rich Cities/Poor Suburbs. There’s a new narrative about cities that claims that we’ve already experienced a great inversion, with poverty in the suburbs and wealth in the cities. Despite the resurgence of city populations in the past two decades, however, it’s still the case that poverty, especially concentrated poverty, is disproportionately found in cities, and that suburbs, especially newer and more distant ones, have much lower rates of poverty. At current rates of change it will be many decades before city and suburban poverty rates are equal. Rather than assuming that any movement of better educated and higher income people into cities makes their problems worse, we ought to look to see how we can leverage the re-investment in cities in away that increases opportunity and maintains diversity.
This week’s must reads
1. Implementing a carbon tax: politics makes strange enemies. In less than three weeks, Washington State voters will decide the fate of a proposed carbon tax. I-732 would impose a $25 per ton carbon tax, and use the proceeds to reduce the state’s sales taxes and pay rebates to low income families, as well as cutting some business taxes. A key aspect of the plan is that it is revenue-neutral—with the funds raised by the tax entirely returned in the form of tax cuts. While that’s a feature for some advocates, it’s a fatal bug to other interests, which is why, surprisingly, some of the strongest opposition comes from a number of environmental and social justice groups. Writing at Vox, David Roberts tells the story of a how a progressive economist’s market-based pricing solution for climate change has run into a buzz-saw of political opposition from groups who’d like to see carbon tax revenue used to fund a slew of clean energy and transition support programs. The practical difficulties of engineering an agreed-upon policy approach to climate change – among groups that agree something needs to be done –likely foreshadows the conflicts that will play out when this issue finally reaches the national stage, which one hopes will be sooner rather than later.
2. Achieving economic integration: Tales from Chappaqua. Bill and Hilary Clinton live in (for the next little while at least) in Chappaqua, New York, an up-scale suburb in Westchester County. In addition to its famous residents, Chappaqua is also ground zero for the battle to build more affordable housing in an area that has traditionally been zoned almost exclusively for relatively expensive single-family homes. Politco relates the history of the city’s exclusionary policies, and describes the present day conflicts in trying to site affordable multi-family housing. As President Obama’s recent endorsement of “YIMBY”-Yes in my backyard zoning reforms indicates, this may become more of a national issue in the months ahead.
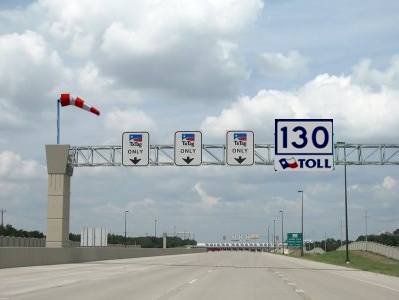
3. A road much less traveled. Between Austin and San Antonio, there’s a brand new freeway where you can cruise along—legally—at 85 miles per hour. And you’ll find that it’s nearly free of traffic. And that’s the problem: the SH 130 toll-road, built by one of those vaunted “public-private partnerships” we hear so much about, is careening into bankruptcy. The San Antonio Express-News calls the project “a monument to failure” and tells the story of how wildly optimistic traffic estimates and federal loan guarantees led to the construction of a billion dollar highway, that nobody seems to think is worth paying to drive on.
New knowledge
Historical Maps of Redlining. And this week, we have some “old knowledge” in a new form. A team of researchers from three universities, including the University of Richmond, the University of Maryland, Virginia Tech and Johns Hopkins, has digitized the maps and neighborhood descriptions compiled by the Home Owners Loan Corporation (HOLC) in the 1930s. These maps show the redlining of many urban neighborhoods that pre-figured decades of disinvestment and decline. In addition to the maps, you can also read individual, type-written descriptions of particular neighborhoods.
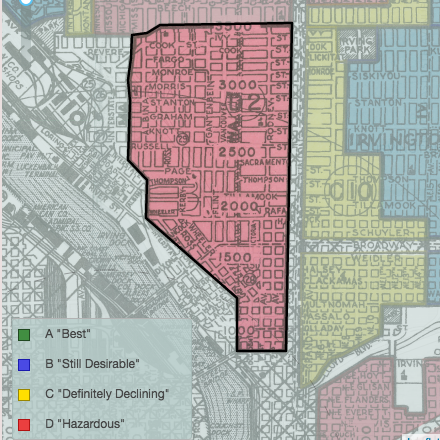
Although the HOLC maps are often themselves blamed for redlining and disinvestment, its actually more likely that they mostly codified widespread community attitudes about older, poorer and minority neighborhoods. The maps and descriptions were compiled by mortgage lenders, developers and real estate appraisers. And some academic evidence suggestions that HOLC and others still made loans in the redlined areas—although at higher interest rates. The maps and the narrative are well-worth a read: they provide a real historical context for thinking about the way “neighborhood stigma” can become the kind of self-fulfilling prophecy that has long term economic consequences.
