What City Observatory did this week
1. Rent control’s impact on the San Francisco housing market. A new study from three Stanford economists dissects the impacts of rent control in San Francisco. Using a late-in-the-game revision of the rent control law (that extended controls to previously exempt 1-4 unit structures), and an impressive pile of big data, the study creates a quasi-experimental design that compares the rents, tenancy and fates of buildings that were exempt from rent control with those covered by it. The results: those lucky enough to get rent controlled apartments got economic benefits (savings worth about $2,300 to $6,600 per year). But the loss in rental income prompted landlords to renovate buildings (moving them up-market, and charging higher rents), to demolish some older buildings and replace them with new, unregulated ones, or to convert them to condominium or cooperative ownership. The net effect was to reduce the supply of rental housing, and drive up rents market-wide by 7 percent. The rent increases to those not covered by rent control effectively offset all of the savings to those who got rent controlled apartments.
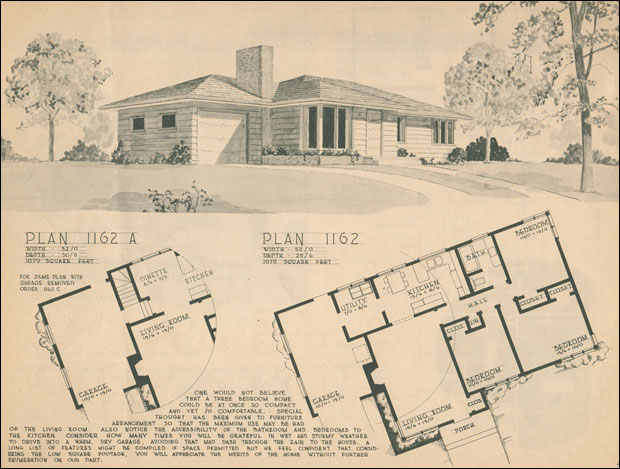
2. Back at the Ranch. In the 1950s, America built millions and millions of ranch houses, typically a three bedroom, one bath, one floor home with about 1,200 square feet and a single car garage or carport. Coast-to-coast, the price of these homes was in the same rough price range, and was affordable to middle-class Americans. Half a century later, the economic fate of the ranch home varies dramatically by housing market. In many cities, the ranch home is the staple of affordability; a ranch house costs as little as $25,000 in Cleveland. But in other places, similar size and vintage ranch homes command more than a million bucks. Why some ranch homes are affordable now, and others aren’t tells us a lot about how housing markets work–or don’t–depending on the local economy and housing regulations.
3. The cost of federal pre-emption of autonomous vehicle regulation. States and cities are often described as the laboratories of democracy, the places where we develop innovative approaches for dealing with new problems. In a guest column, Noah Siegel lays out the case for giving local jurisdictions more latitude to develop the rules and policies that will guide the implementation of autonomous vehicles.
Must read
1. Jan Gehl on City Scale. ArchDaily has a short but insightful interview with Danish urbanist Jan Gehl, who once again, patiently reminds us of the importance of thinking about scaling our streets, buildings and public spaces to the bipeds who inhabit them. When spaces are built for human beings walking at five kilometers per hour, we feel safe and comfortable. When they’re engineered for vehicles going ten times faster, we are uncomfortable and alienated. Because walking is either impossible, unsafe, or uncomfortable (or all three), we walk less, which diminishes our health, and saps city streets of the human presence that makes them lively and interesting.
2. Philadelphia considers inclusionary zoning. Plan Philly’s Jake Blumgart has an analysis of Philadelphia’s proposed inclusionary zoning ordinance. The battle lines are predictably drawn between housing advocates, who see IZ as a way to get more units for low and moderate income households, and developers (and economists) who argue that the IZ requirements are likely to drive up the cost of development, and deter new construction (and by lowering housing supply, drive up rents). The Philadelphia ordinance is notable by requiring that some IZ units be affordable to households with very low incomes (30% of area median incomes), a burden that’s likely to have a strongly negative effect on development economics in a less than super-heated market like Philadelphia.
3. How is the housing market like musical chairs? Ever struggle to explain the basics of housing economics at a cocktail party? You’ll want to take a close look at the Sightline Institute’s new explainer video “Cruel Musical Chairs: Why the rent is so high.” It’s an apt metaphor for the housing market: If there are more households seeking houses than there are homes in the community, they’ll bid up the prices and those with the least resources (like the slow-moving in musical chairs) will be out of luck. The solution is straightforward: add more chairs (homes). The video subtly makes another key point: it really doesn’t matter whether you add fancy chairs or plain ones to the game, solving the availability/affordability problem hinges on their being more chairs, and the same applies to housing.
4. Does Portland’s transit agency prioritize construction over service? In an essay at Medium, local activist Andrew Reilly claims that “TriMet’s Budget is an elaborate shell game.” Reilly charges “It’s acting deliberately, ideologically, against the public interest: TriMet bosses intentionally use “funding constraints” as an excuse to avoid justified criticism of their priorities as a company.” Though it pleads poverty when it’s pressured by citizens to expand bus service or discount fares, it has used a significant amount of the revenue that’s potentially available to pay for transit service to be instead used to pay debt service for capital construction projects, like expansions to the light rail system. And it’s not chump change; the current TriMet budget identifies $85 million as “operating resources dedicated to capital.” These priorities are out of line with the interests of the region’s transit users, according to Reilly. It’s a provocative piece that raises important issues about how the region’s transit system should be planned and managed.
New knowledge
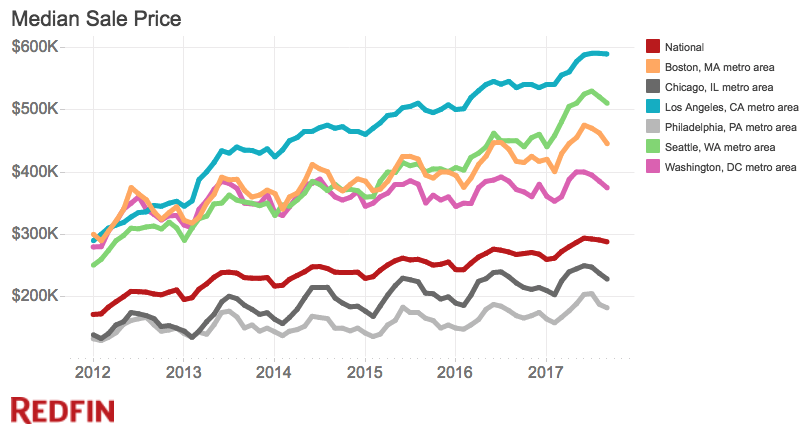
Redfin’s Residential Real Estate Data Center. Redfin is a national real estate brokerage, and one of the nation’s leading sources of housing market intelligence. (We’re big fans of WalkScore, their invaluable tool for quickly assessing the walkability of any house in America). Redfin tracks home sales, prices and inventory across the nation, and now makes that information available through an accessible and easy to use web dashboard. Here we’ve pulled out data on median sales prices in leading national markets for the five years 2012 through 2017. You can also look at for sale inventory, price per square foot, the number of days a typical listing has been on the market, and other indicators. Much of the data is available at the zip code level, allowing you to track neighborhood level price changes.
In the news
Oregon Business published Joe Cortright’s commentary on the Amazon HQ2 sweepstakes, “Why Amazon’s HQ2 will never come to Portland.” It’s not because Portland doesn’t have all the right stuff to be the headquarters of a fast-growing tech firm; it’s just that it’s too similar, and too close to Seattle to effectively diversify Amazon’s ability to recruit talent.
StreetsblogUSA reposted our commentary on the progressivity of peak hour road pricing. The incomes of car commuters generally, and peak hour car commuters in particular, are much higher than for the rest of the population, so the incidence of congestion pricing is relatively progressive. In Portland, the median income of those commuting by car in the peak hour is roughly double that of those who commute to work by transit, biking or walking.
