What City Observatory did this week
1. Does Rent Control Work: Evidence from Berlin. Economists are nearly unanimous about rent control: they think it doesn’t work. Berlin’s recent adoption of a new rent control scheme in 2015 provides a new test case to see if they’re right. An early analysis of the Berlin program shows that it’s done little to reduce rents, and even though the program was intended to address affordability problems for low and moderate income households, most of the benefits have gone to those renting the most expensive apartments.

2. Does Cyber-Monday mean package delivery Gridlock tuesday? The growing volume of e-commerce has led some pundits to worry that city streets will be clogged by delivery vehicles. But while we are getting many more packages at our homes, the growth of actual truck traffic has been much slower, in large part because growing volumes produce economies of scale for shippers. More packages mean higher delivery density, more stops per mile traveled, and less energy, pollution and labor per package delivered. In addition, e-commerce purchases mean fewer shopping trips. On balance, e-commerce is likely to reduce, rather than increase overall traffic.
3. Destined to disappoint: Housing lotteries. The demand for affordable housing is so great and the supply of subsidized housing so small, that cities frequently have to resort to lotteries to allocate units to deserving households. An analysis of New York City’s lotteries for the past three years showed that nearly half of all winners fell into the 25 to 34 year old age category, leading to speculation that the lottery is somehow tilted in favor of young adults. We look at the population that’s likely to be seeking an rental apartment in New York, and find little discrepancy between the population and lottery winners. The bigger problem with lotteries is that so few units are available: Fewer than two-tenths of all the households moving to an apartment in New York in the past year were lottery winners.
4. Why biotech strategies are often 21st Century snake oil. Cities and states around the nation have invested hundreds of millions of dollars in public funds in efforts trying to make themselves the next hub of biotechnology. But like many biotech ventures themselves, this is a high-cost, high-risk undertaking. In one particularly epic example, a small town in Minnesota spent more than $30 million in state and federal funds on highway improvements for its biotech park, based in large part on the assurances that a prominent national biotech analyst could provide a $1 billion venture fund. You’ll never guess what happened next.
Must Read
It’s been an incredibly prolific week for “must read” articles, so we’re highlighting a few more than usual. We have two very insightful commentaries on road safety and inclusionary zoning, and four articles dissecting the results of the November 8 national election (hopefully we’ve reached peak political post-mortem).
1. The real reason the US has so many traffic deaths. The surge in crashes and traffic deaths in the past few years has re-kindled concern about road safety, and prompted a wave of media reports pointing a finger of blame at texting while driving. At City Observatory, we’ve been skeptical of this explanation. Now, Vox has published a comprehensive essay from by , reminding us of the big structural reasons why American traffic deaths are so much higher than in other countries–and it has almost nothing to do with texting. Not only do Americans drive many more miles (or kilometers, if you prefer), but added driving has been spurred on by cheaper gas prices. Garrick and his co-authors conclude that the recent increase in crash rates and deaths is almost fully explained by the decline in gas prices and lower unemployment rates. That’s not to say texting in a car is a good idea, but our road safety problems are more fundamental and deep-seated.
2. In many cities, inclusionary zoning–mandating that those building new housing in cities include a fixed proportion of affordable units–is seen as an easy way to force developers to solve the affordability problem, at no cost to the public. Writing at the Sightline Institute, Dan Bertolet and Alan Durning consider whether inclusionary zoning is the most promising or most counter-productive strategy for tackling this problem. They argue that uncompensated inclusionary zoning–where the costs of added units are borne entirely by the developer–simply pushes up the market price of housing, reduces the number of new units built, and actually makes housing affordability problems worse. In theory, they say that if developers costs are compensated or offset (by some combination of density bonuses, faster permit approvals, lessened parking requirements or tax breaks) that these negative effects could be reduced or eliminated. While that’s likely to be true, the very practical question that gets begged in this analysis–and in most IZ debates–is whether these “offsets” are large enough to truly cover the higher costs. This article is a thoughtful exploration of many of the points that come up in debates over inclusionary zoning. Its an absolute must read for anyone who cares about housing affordability.
3. The election, by metro area. Mapping how America’s metro areas voted. Richard Florida breaks out the election returns by metropolitan area, finding that most large metropolitan areas voted for Hillary Clinton, while most smaller ones voted for Donald Trump. Clinton won more than three-quarters of the votes in the San Francisco metro area and more than two-thirds of the votes cast in the San Jose, Washington and New York metro areas. Of the nation’s largest metropolitan areas (those with a million or more population), ten of them (including Oklahoma City, Dallas, Pittsburgh and Cincinnati) awarded at least a majority of votes to Donald Trump; in five other metropolitan areas Trump won a plurality of the Presidential vote.
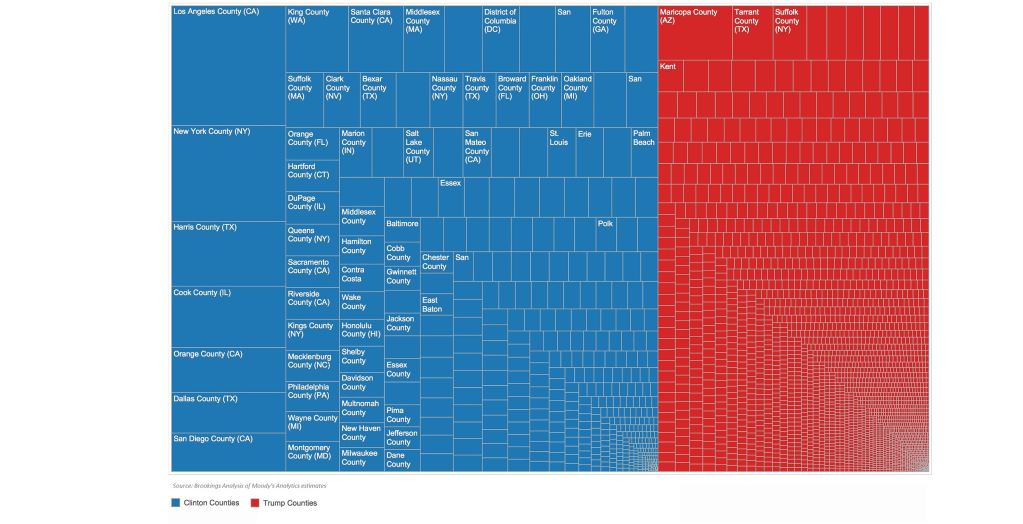
4. The election, by productivity. In “Another Trump-Clinton Divide,” the Brookings Institution’s Mark Muro slices county-level election returns by gross domestic product. He finds that the most economically productive counties in the US (again, overwhelmingly in large metro areas) tended to vote strongly for Hillary Clinton. In all, the counties that voted blue in 2016 accounted for 64 percent of US GDP, compared to only 36 percent of GDP in red counties. The economic disparity between red and blue counties has apparently widened. In the similarly close 2000 presidential election, counties that voted for Al Gore produced 54 percent of US GDP, compared to 46 percent for the counties who voted for George W. Bush. (Imagine electoral votes were apportioned by economic output).
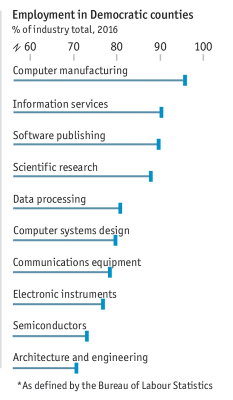
5. The election, by tech-based economic development. The Economist’s “Graphic Detail” feature further sharpens this economic view of politics by looking at how tech-dominated counties voted in the election. (There’s a fair amount of overlap here between high tech counties and high productivity ones). Their summary: “In counties that favoured Democratic presidential candidates between 2000 and 2016, employment in high-tech industries grew by over 35%. In Republican-leaning counties, such employment actually fell by 37%. Today, there are more than three times as many high-tech industry workers in places that voted for Hillary Clinton as there are in those that favoured Mr Trump.” Something on the order of 90 percent of the nation’s employment in computer manufacturing, software publishing and information services is located in counties that voted Democratic in the 2016 election.
New Knowledge
1. The 500-pound gorilla in US retailing is the fast-growing e-commerce behemoth, Amazon. There’s little question that its growth has had a significant effect on the retail landscape, contributing first to the decline of independent bookstores, and more recently, it is argued, to the overall shrinkage of the number of retail establishments in the US. A new report from the Institute for Local Self-Reliance–Amazon’s Stranglehold: How the Company’s Tightening Grip is Stifling Competition, Eroding Jobs, and Threatening Communities, — takes a comprehensive and critical look at Amazon’s growth and impacts. There’s a huge amount of information here, addressing everything from the growth of e-commerce and Amazon’s market share, to working conditions in Amazon warehouses, and the competitive effect. While the report’s tone can be a bit hyperbolic, and its title and chapter heads leave little doubt as to the authors’ feelings — “monopolizing the economy, undermining jobs and wages, weakening communities” — there’s plenty of hard data as well.
2. More evidence on lead and crime. A growing body of research points to the substantial role that exposure to lead played in determining crime rates in US cities. While much of the research examines the correlation between atmospheric lead (from burning leaded gasoline) and the rise and subsequent decline in urban crime rates, a new study takes a look at a different source of exposure: lead water pipes. Many cities routinely used lead water pipes at the end of the 19th century, and by comparing crime rates in cities with lead and iron water pipes, James Feigenbaum and Christopher Muller are able to tease out the connection between lead exposure and city crime. In their paper “Lead Exposure and Violent Crime in the Early Twentieth Century, they show that cities with lead water pipes had crime rates that were 24 percent higher than cities that didn’t use lead.
