What City Observatory did this week
Exit, hope and loyalty: What’s behind neighborhood change? America’s neighborhoods are always changing, and it’s often a question of whether change is driven more by hope or despair. We offer a slight tweak to Albert Hirschman’s trinity of “Exit, Voice, and Loyalty” to explore the choices and decision-calculus confronting neighborhood residents. In struggling neighborhoods, long-term residents often have to choose between their loyalty to a particular place, and the potentially greater opportunity that they can realize by leaving. What mediates their decision in many cases is the hope or expectation that despite its current problems, that a neighborhood may get better. Almost all neighborhoods have loyalists, who will stick things out no matter what happens, but most, when they see decline, and lose hope, will move on. This dynamic makes it imperative that urban leaders provide a clear path to improvement, if they’re to reverse steady and self-reinforcing decline.
Must read
1. The unsustainable economics of single-occupancy vehicles. The Economist has a thoughtful essay on the deep subsidies that prop-up automobile transportation. The recent initial public offerings of Uber and Lyft have pointed up the stupendous billions of dollars of losses the company’s investors have underwritten to attract riders. As The Economist points out, these are just the venture capital equivalent of what the public sector has been doing for decades: insulating travelers from the actual cost of operating private vehicles, particularly in dense urban environments.
2. Travel demand modeler’s can’t even see they have a Ben and Jerry’s problem. There’s a very wonky website/list-serv for traffic modelers called “TMIP” (the Travel Model Improvement Portal) which explores the quite arcane details of how one builds complex mathematical models of road systems and then tries to forecast the behavior of travelers using the system. A recent discussion wrestled with the question of how to deal with induced demand–the idea that adding more capacity to roads in dense metropolitan areas simply tends to trigger additional driving on those roads. There’s a lot of debate about what causes induced demand (is it new trips, or just a reallocation of trips in time, between mode or across space), and some hair splitting rhetorical arguments about whether it ought to properly be called “induced” or “latent” demand. To the economist, however, this is mostly and irrelevant side-show: travel modelers are obsessed with computing travel behavior for a system that effectively charges zero price. Just like Ben and Jerry’s on free ice cream day, the number of ice cream cones “demanded” will always be large, and outstrip the store’s capacity. The modeling profession has so thoroughly internalized the “free ice cream” model that it really can’t talk about demand in a coherent way.
3. Jenny and Matt explain American’s housing problem(s). The Brookings Institution’s Jenny Schuetz sat down with Vox’s Matt Yglesias to talk housing, and the result is well worth a read–or better, a listen. Housing is really a series of inter-connected problems, including high rents, low incomes, and a lack of supply. Schuetz outlines seven distinct steps we ought to be taking to address housing and housing affordability: these include more universal and automatic rent assistance for low income households, greater housing supply, especially in high demand regions and neighborhoods. There are important steps for federal, state and local policy makers, key among them will be measures to change the way state’s delegate authority for development decisions to local governments. As Yglesias puts it:
The most socially and economically valuable place to build new housing would be in the most expensive, most affluent neighborhoods and suburban towns — but to make that happen, state governments will have to override local zoning regulations.
We rarely recommend podcasts and interviews: The time commitment is often large, it’s difficult to glean the highlights quickly, and the information density is just less than in well laid out web pages or documents. This is an exception: In less than an hour with this podcast, you can get a crash course in housing economics from one of the smartest scholars in the field, interrogated by a well-informed host. It’s well worth the time spent.
New Knowledge
Car ownership, income and density. Trulia economist Issi Romem has a new analysis of Census data on the patterns of car ownership, and how they vary across metropolitan areas, based on neighborhood income and population density. Romem has tabulated and mapped zip code level data. In general, we know that car ownership is positively related to income (households with more income are more likely to own cars, and own more cars per household member); and that car ownership is inversely correlated with density (people who live in denser neighborhoods tend to own fewer cars. Romem’s analysis shows how these two general tendencies play out in different metropolitan areas.
Here are charts showing the relationships between income, density and car ownership for four major US cities: Boston, New York, Houston and Los Angeles. In these charts, density is shown on the vertical axis (densest zip codes are higher), and income is shown on the horizontal axis (higher incomes are to the right). The color of dots on the charts correspond to the number of persons per vehicle, with darker colors indicating lower rates of car ownership per person.
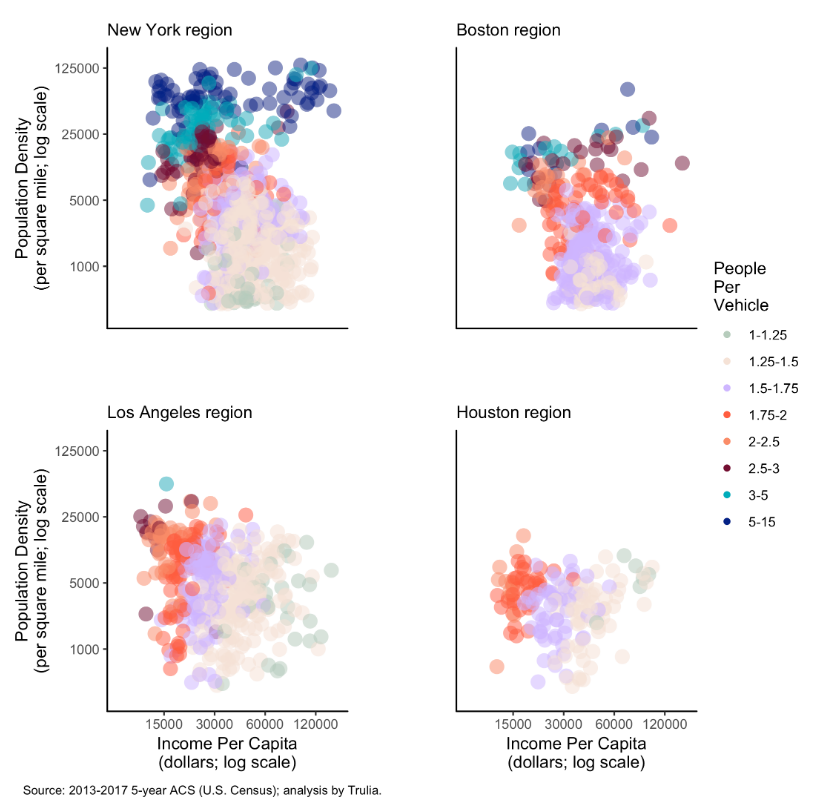
The there’s a striking difference in the patterns for the two sets of metro areas. New York and Boston show a pattern of horizontal stripes–car ownership varies by density for people of all incomes. Even wealthy people in dense neighborhoods own fewer cars. In Los Angeles and Houston, the stripes are nearly vertical: car ownership varies almost entirely by income, and very little by density. If you have income, you own a car. It’s also worth noting that very few neighborhoods in Los Angeles and Houston exceed about 50,000 persons per square mile–the level at which both high and low income households are very likely to own few cars, according to Romem’s analysis.
Romem helpfully provides zip code level maps and data for all of the nation’s large metropolitan areas, so you can examine where your city falls on this spectrum, and look at values for particular neighborhoods.
Issi Romem, Trulia, “Getting around, or just getting by: Where people live with fewer cars,” May 16, 2019.
