As Jane Jacobs so eloquently described it in The Death and Life of American Cities, much of the essence of urban living is reflected in the “sidewalk ballet” of people going about their daily errands, wandering along the margins of public spaces (streets, sidewalks, parks and squares) and in and out of quasi-private spaces (stores, salons, bars, boutiques, bars and restaurants).
Clusters of these quasi-private spaces, which are usually neighborhood businesses, activate a streetscape, both drawing life from and adding to a steady flow of people outside.
In an effort to begin to quantify this key aspect of neighborhood vitality, we’ve developed a new statistical indicator—the Storefront Index (click to see the full report)—that measures the number and concentration of customer-facing businesses in the nation’s large metropolitan areas. We’ve computed the Storefront Index by mapping the locations of hundreds of thousands of everyday businesses: grocery and hardware stores, beauty salons, bookstores, bars and restaurants, movie theatres and entertainment venues, and then identifying significant clusters of these businesses—places where each storefront business is no more than 100 meters from the next storefront.
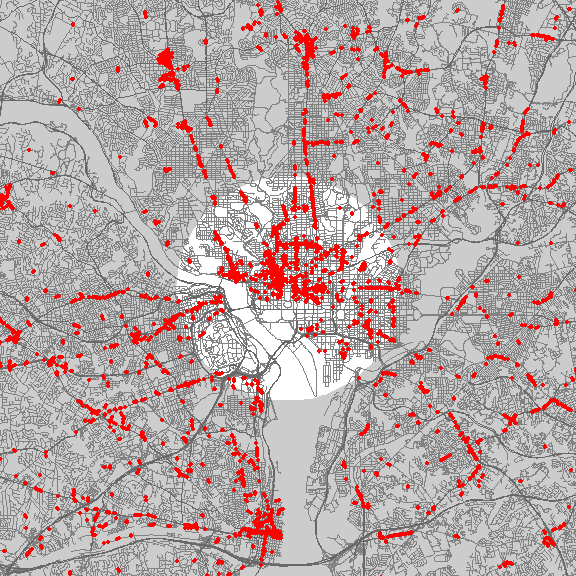
The result is a series of maps, available for the nation’s 51 largest metropolitan areas, that show the location, size, and intensity of neighborhood business clusters down to the street level. Here’s an example for Washington, DC. On this map, each dot represents one storefront business. This maps shows storefront businesses throughout the metropolitan area. In downtown Washington, there is a high concentration of storefronts; as one moves further out towards the suburbs, the number of storefronts diminishes, and storefronts are increasingly found arrayed only along major arterials, with a few satellite city centers (like Alexandria).

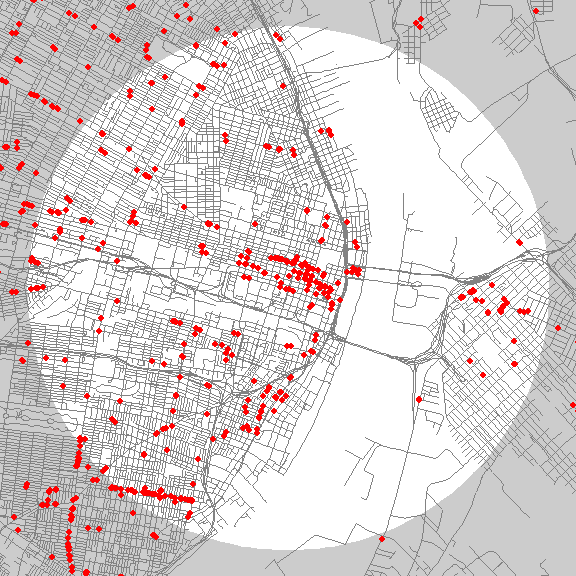
The Storefront Index helps illuminate the differences in the vibrancy of the urban core in different metropolitan areas. Here we’ve constructed identically scaled maps of the Portland and St. Louis metropolitan areas, zoomed in on their central business districts. The light colored circle represents a three-mile buffer around the center of downtown. In Portland, there are about 1,700 storefront businesses in this three-mile buffer—with substantial concentrations downtown, and in the close-in residential neighborhoods nearby. St. Louis has only about 400 storefront businesses in a similar area, with a smaller concentration of storefront businesses in its center, and fewer and less dense commercial districts in nearby neighborhoods.


The Storefront Index is one indicator of the relative size and robustness of the active streetscape in and around city centers. As this table shows, there’s considerable variation among US metropolitan areas in the number of storefront businesses with three miles of the center of downtown. New York and San Francisco have the densest concentrations of storefront businesses in their urban cores.
Maps of the Storefront Index for the nation’s 51 largest metropolitan areas are available online here. You can drill down to specific neighborhoods to examine the pattern of commercial clustering at the street level.
We also use the Storefront Index to track change over time, looking at the growth of businesses and street level activity in a rebounding neighborhood in Portland. There’s also strong evidence to suggest that concentrations of storefront businesses provide a conducive environment for walking. We’ve overlaid the storefront index clusters on a heat map of Walk Scores for selected metropolitan areas to explore the relationship between these two measures. While Walk Score includes destinations like parks and schools, as well as businesses, it also measures walkability from the standpoint of home-based origins, while our Storefront Index shows the concentration of commercial destinations.
City Observatory has developed the Storefront Index as a freely available tool for urbanists and city planners to use in their communities. The index material is licensed under a Creative Commons Attribution license (as is all City Observatory material), and a shape file containing storefront index information is available here.
