Adjusted for inflation, US home prices are still lower than in 2006
For most US households, the home they own is their biggest financial asset. After the housing bust of 2007, when collectively about $7 trillion in home value was wiped out by declining house prices, many people have looked to subsequent increases in home prices as an indication that things are getting back to normal, at least in the housing market.
For example, the US Census Bureau reported that in the third quarter of 2018, the average asking price for a home for sale ($206,400) exceeded the previous peak price recorded in 2007 ($201,500). Surely this means that the effects of the housing bust are now behind us, right?

But there’s a problem in making these comparisons over long periods of time: as the footnote in this chart concedes, they don’t account for the effects of inflation. If we’re going to appraise whether housing is really a good investment, we need to know whether it’s price is increasing faster than inflation. And as we’ve long argued at City Observatory, there’s a flip side to this debate: if house prices are rising faster than inflation, it suggests that housing is becoming relatively more expensive and unaffordable. Housing can’t be both a great investment and be affordable.
To get a more accurate picture of the affordability and return on investment from housing, we’ve adjusted a major home price index for inflation. Our nominal home price data comes from Zillow, which reports monthly its estimate of the Zillow home price index for the nation and for every metropolitan area. While people love to pick nits with Zillow’s estimates of the value of their houses, their model of regional housing prices is one of the best out there–it was just adopted by the Federal Reserve Board’s economists as its preferred data series for estimating American households’ housing wealth. To adjust for inflation, we use the consumer price index for urban consumers, excluding shelter. We’ve computed the average price of single family homes, per the Zillow’s data in inflation-adjusted 2018 dollars.
Here’s the national picture.
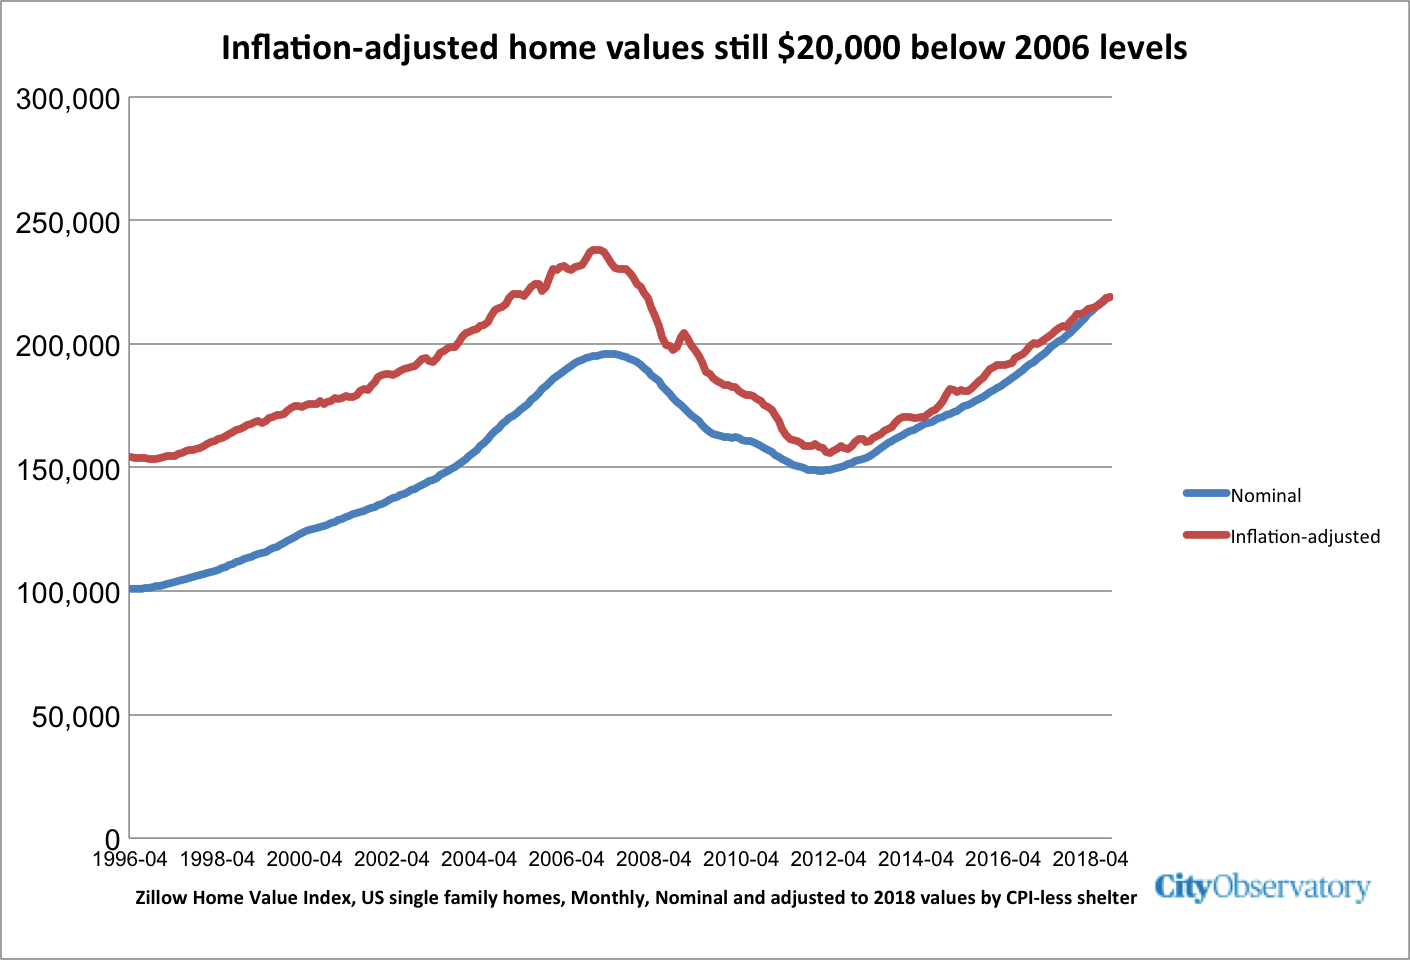
The blue line shows home prices in nominal dollars, while the red line shows the price of homes in 2018 dollars for the entire two-decade long period. According to Zillow, while the nominal price of housing has recovered the level recorded at the peak of housing market bubble, the picture is considerably different if we look at real, inflation-adjusted prices. Real home prices peaked at about $238,000 in the fourth quarter of 2006, and today are still about $20,000 less than that amount, $218,000.
Timing matters. On average, the typical person who bought a home in the United States between 2004 and 2008 would find that today, in inflation-adjusted terms, there house was still worth less than it was when they bought it. If you had the foresight (and the credit score and down payment) to buy into the market in 2012, when inflation-adjusted prices hit rock bottom, you’ve seen a healthy appreciation over the past six years. But as we’ve pointed out at City Observatory, swings in credit availability work to systematically disadvantage lower income and lower wealth buyers, who tend disproportionately to be people of color. When it makes sense to buy (when prices are low) mortgage lending is typically difficult to obtain. During the bubble, as we recall, when it was a bad idea to buy, lending standards were relaxed, and many households that couldn’t weather the downturn bought homes that soon plunged them into default or bankruptcy, which is a key reason for the disproportionate decline in home equity wealth and home ownership for people of color.
Regional Variation
The national averages mask considerable variation across the different regions of the country. In some places (like San Francisco), the housing market is booming and is hitting new highs. In others, home values languish well below the peaks established during the housing bubble. Adjusting for inflation shows which places have made a real comeback in home values, and which ones are still, in real terms, less valued than they were in 2006.
This map shows the percentage change in real home prices for the nation’s fifty-three largest metropolitan areas. Metros shaded in green have housing prices that are higher in inflation-adjusted terms than in 2006; metros shaded in red have housing prices that are lower now than in 2006. Clicking on individual metro areas shows the 2006 and 2018 home price values for that metropolitan area.
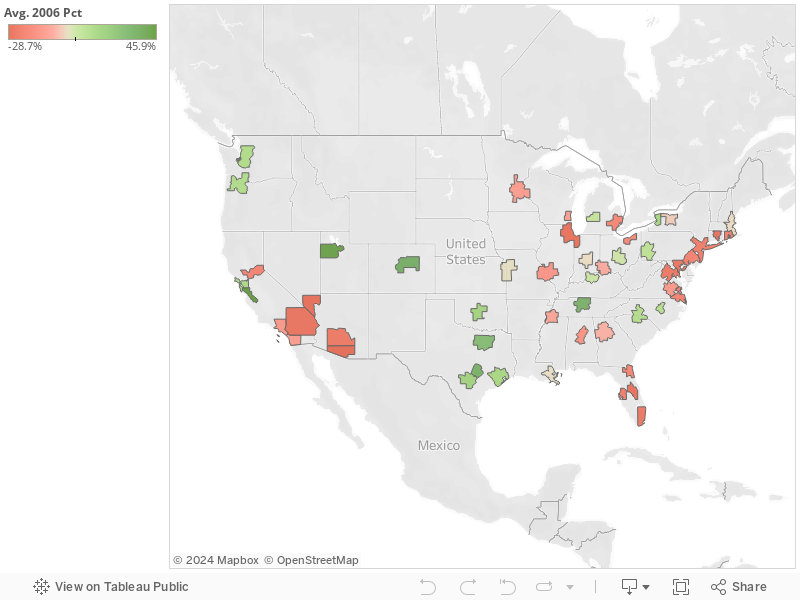
Of these, 21 metropolitan areas have higher real home prices now than at the market’s peak in 2006. Most metropolitan areas–32 of the 53 largest, have real home prices that are lower now than they were in 2006. By a large margin, most of the residents of these large metropolitan areas live in a housing market where values are still lower now, adjusted for inflation, than twelve years ago. Some 124 million people live in the 32 metropolitan areas where real housing prices are still below 2006 levels; just 50 million live in the 21 metropolitan areas where real housing prices are now higher than in 2006.
The takeaway: Housing isn’t always and everywhere a good investment
It’s tempting to just look at the nominal dollar figures on average home prices and assume that the housing bubble and subsequent bust are a receding memory. But the damage from that cycle is still apparent in a majority of large American metropolitan areas. Between 2006 and 2018, housing values haven’t kept pace with inflation, meaning the real value of housing has declined. In the face of those who are telling you that “now is a good time to buy,” it’s good to remember that the housing market is actually a risky one.