The US faces a shortage of cities. More and more Americans, especially talented, young workers with college degrees, are looking to live in great urban locations. As we’ve explored at City Observatory, the demand for urban living has increased faster than the supply of great urban spaces—with the predictable result that the price of land is appreciating faster in cities. We’ve pointed to a growing body of data—stronger residential price growth in urban cores, faster appreciation for homes in more walkable areas, a more rapid growth of office rents in walkable locations—all of which signal the growing market value of living and working in cities.
This trend also clearly manifests itself in the residential rental marketplace. New data from multifamily market analyst RealPage shows that apartments in big cities have seen higher rent increases than in smaller ones.
The RealPage data enable us to divide the US top 100 US markets into three broad groups: the nine hottest coastal markets, the remaining 41 of the 50 largest metropolitan areas, and 50 smaller metropolitan areas. Data shown here are for the fourth quarter of 2008 and 2015 and are expressed in inflation-adjusted dollars. Percentages shown are the percent increase in real, inflation-adjusted rents over the entire seven-year period.
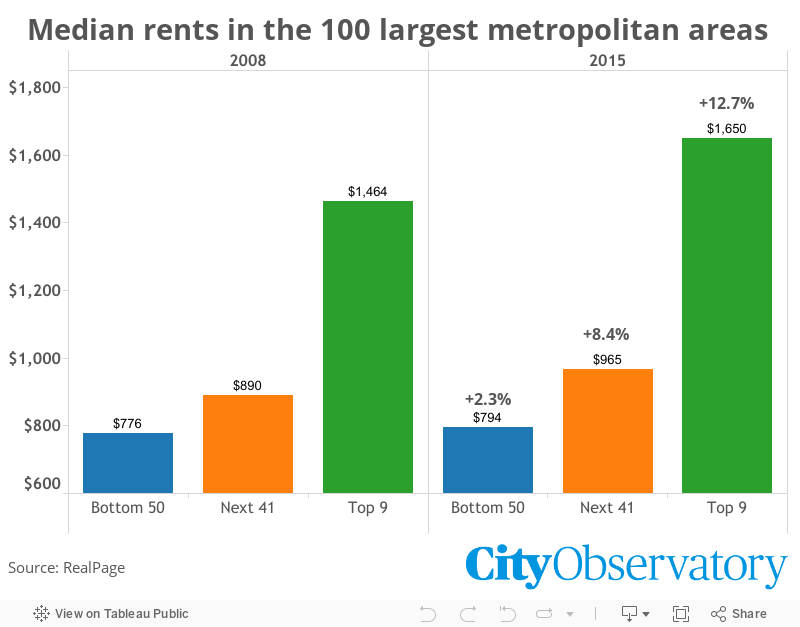
The most obvious point is that the large, hot markets are showing the biggest increases, at all price points. The nine markets are all on the East Coast (New York, Boston, Washington) and West Coast (Southern California, the San Francisco Bay area and Seattle). In the nine hot markets, median rents increased about 13 percent, compared to 8 percent for other metro areas in the top 50 and just 2 percent for metros ranked 50th through 100th in size.
As interesting as the pattern of change is across markets, the change within metro markets is also instructive. In every size market, rents are increasing fastest in the highest priced segment of the market place. RealPage reports the average rents for the median apartment, as well as the apartments representing the 25th and 75th percentiles of the marketplace. Think of the 75th percentile as representing the cutoff for the top one-quarter “nicest” apartments, and the 25th percentile representing older, less desirable and more affordable apartments. (We explored the importance of looking at all segments of the rental marketplace to understand affordability a few months back; in many ways, having a broad range of price points within the market is a better indicator of affordability than the median).
The most expensive apartments in the most expensive cities are seeing the fastest rate of price appreciation. For example, in the top nine coastal markets, rents for the 75th percentile apartment increased by about 23 percent, while apartment rents for the median and 25th percentile apartments increased only about half as fast (10 percent and 12 percent respectively). What this signals is that the demand for urban living is being fueled by the preferences of high income households rather than simply a generalized increase in rents that affects every segment of the marketplace equally.
The next 41 largest metropolitan areas–those rounding out the list of the fifty largest metropolitan areas have lower rates of price appreciation overall, but exhibit the same within metro pattern of greater price increases at the higher end of the market. Rents at the 75th percentile increased about 13 percent between 2008 and 2015, but only about 8 percent for the median apartment and 7 percent at the 25th percentile.
What this signals is robust demand for high-end apartments in the nation’s largest and hottest markets. As RealPage economist Shane Squires points out in his commentary on this data, much of the demand for new, high-end product is in walkable locations in cities, where it doesn’t compete directly with more affordable (but far less accessible) suburban locations. This is also consistent with the hypothesis offered by Edlund, Machado and Sviatchi, that time-pressured, dual income households are increasingly willing to pay higher rents in urban centers for better accessibility to jobs and consumption opportunities.
The RealPage data provide nuanced insights into rental price trends that aren’t fully reflected in the usual measures that talk only about the “median” apartment. They show that rental prices are changing at very different rates in different markets, and at different price points with metropolitan markets. This more detailed view of where–and why–rents are increasing should be a useful guide to policy makers as they consider how to define and grapple with housing affordability problems.
(RealPage makes its estimates based on data drawn from lease transactions covering about 10 million apartments nationwide.)
