In our first post on the “Sprawl Tax,” we’ve explored the ways that our decisions about how to build American cities have imposed significant costs—in money, time, and quality of life—on all of us. We pay more to drive more, spend more time traveling instead of being at our destinations, and as a result deal with more stress, than we would if our destinations weren’t so widely separated from one another.
But the sprawl tax isn’t equally costly for everyone. We’ve shown how cities that are more compact enable their residents to spend significantly less time and money on transportation than less compact cities.
And what about beyond our borders? When we compare the typical American to her counterpart in other rich countries, it’s clear that the sprawl tax is a national concern, dragging down our disposable income and free time relative to residents of other countries. To illustrate the international dimension of the sprawl tax, we draw on data on travel time and transportation spending compiled by Stephen Redding and Matthew Turner in a recent paper on the connections between transportation infrastructure and urban form.
Household Budgets
The table below shows the fraction of household income that people in 15 European countries, Canada, and the US countries spent on transportation from 2005 to 2009, as well as how much time the average worker in each of these countries spends on a daily roundtrip commute. Let’s take the spending side first.
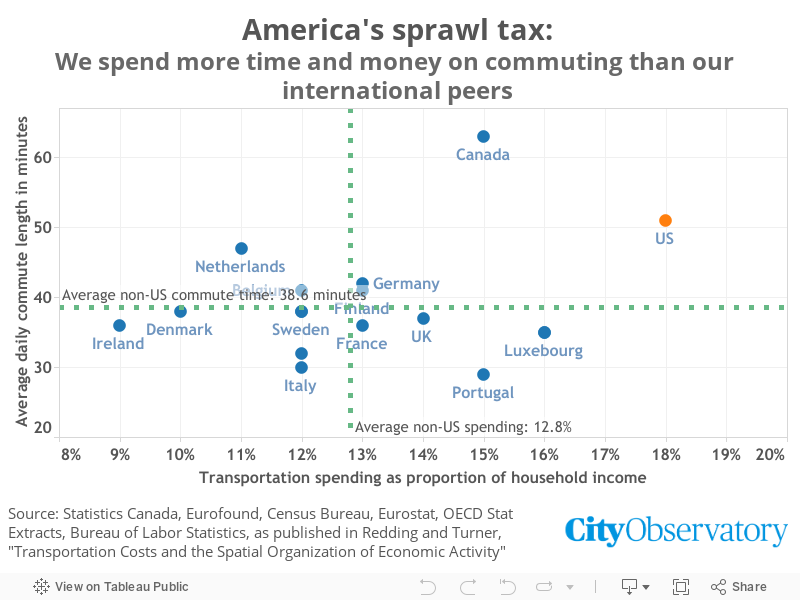
During this time, the average American household spent approximately 18 percent of its budget on transportation. Among the other 16 countries, none spent more than 16 percent, and the average spending level was just 12.8 percent. That means a typical US household spent about five percentage points more of its income on transportation than the residents of other developed countries—which translates to about $1,500 every year.
Here’s how we arrive at this figure: In 2007 (the median year of the estimates presented above) disposable household income in the United States was $31,000 compared to an average of $21,000 in these other nations, according to estimates from the World Bank, based on purchasing power parities that adjust for price differences between countries. If US households spent the same share of their incomes on transportation as did the households in the typical high income country, they would have spent about $1,500 less (.05 * 31,000) on transportation.
Commute Time
The average American worker spent about 51 minutes commuting between home and work and back again—more than all but one other country in the sample. That exception was Canada, where the typical worker spent 63 minutes on their commute—but the rest were lower, all the way down to Portugal, where roundtrip commutes took up just 29 minutes per worker per day. For the other 15 nations examined the average commute time was 39 minutes—about 12 minutes less per day than in the US.
This means that over the course of a year with 250 working days, the typical American commuter spends about 51 more hours (12 minutes times 250 days) commuting to and from their place of work than workers in other high income countries. Valued at $15 per hour, the additional cost of commuting to US workers comes to $770 per worker worker per year.
The International Sprawl Tax
Compared to other high income nations, we spend about $1,500 per household on transportation costs and about $770 per worker more on commute time costs. While there are many reasons for these disparities, in large part, they reflect American cities’ more sprawling development patterns, and the represent a sprawl tax that is paid by Americans.
