Why predicted gridlock almost never happens and what this teaches us about travel demand
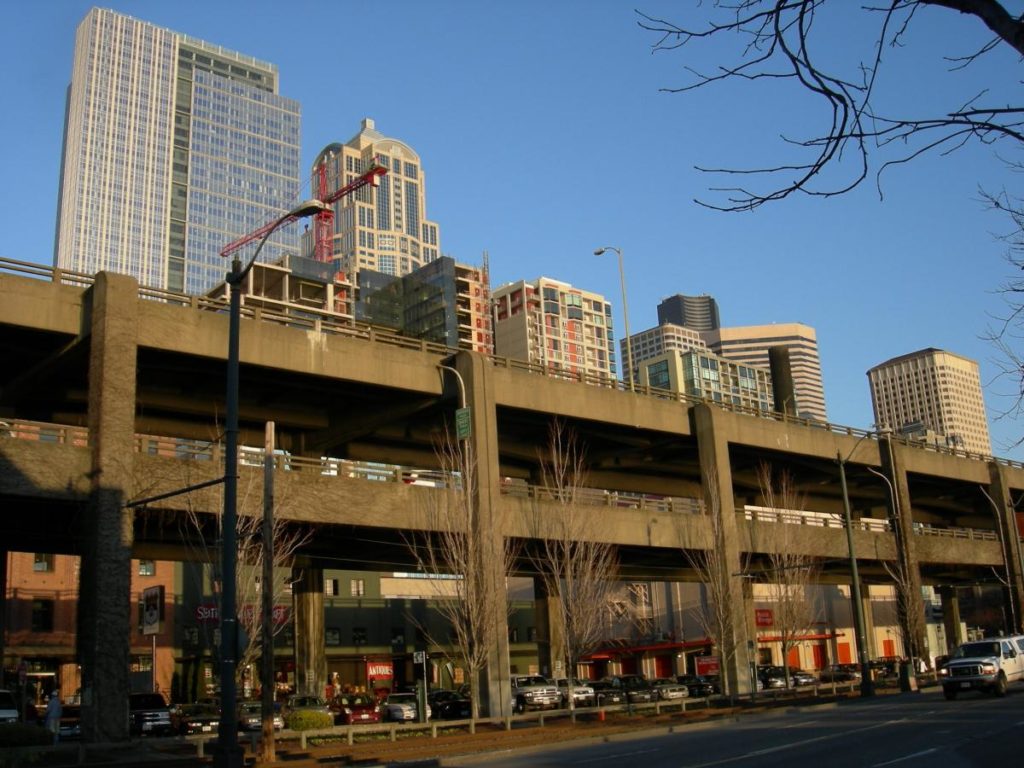
Seattle has finally closed its aging Alaskan Way viaduct, a six-lane double-decker freeway that since the 1940s has been a concrete scar separating Seattle’s downtown from Elliott Bay. In a few weeks, much of this capacity will be replaced by a new 3 billion dollar highway tunnel under downtown Seattle, but until then, the city will have to simply do without a big chunk of the highway system that circulates cars around downtown Seattle.
Transportation agencies and the media love to portray major road closures as the real world equivalents of disaster films. The City of Seattle has even come up with its own ominous moniker THE PERIOD OF MAXIMUM CONSTRAINT, which it says, “sounds like a summer action blockbuster starring Will Smith.”
Losing a major freeway that carries nearly hundred thousand vehicles a day through the heart of the city will certainly cause a major disruption to the traffic. The Seattle Times confidently told its readers in early January to prepare for a traffic cataclysm: “the region can’t absorb the viaduct’s 90,000 daily vehicle trips and 30,000 detoured bus riders without traffic jams that likely will ripple out as far as [distant suburbs] Woodinville or Auburn.” Our friends at CityLab echoed the ominous rhetoric with a story headlined “Viadoom: Time for the Seattle Squeeze Traffic Hell.”
That’s pretty scary stuff. But two days into Seattle’s brush with carmaggedon how are things looking?
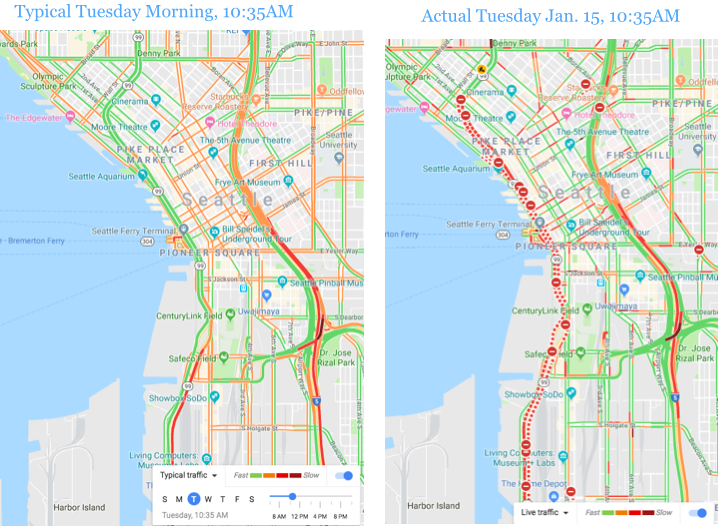
Well, see if you can tell. Here are the Google maps for traffic conditions on a typical day and post-viaduct closure. This first pair of charts shows conditions in mid-morning on Tuesday, January 15th. On the left is Google’s map of typical traffic levels on a Tuesday morning at 10:20 am, using Google’s familiar color-coded congestion rankings (green is moving smoothly, yellow is slowing, red is stop and go). On the right is Google’s real time traffic map of downtown Seattle for Tuesday, January 15th (day two of THE PERIOD OF MAXIMUM CONSTRAINT). You can spot one big difference right away. The right-hand map shows the closed portion of the viaduct shows up as a series of dotted red lines, punctuated with red and white “do not enter symbols” showing closed ramps to and from the viaduct. On an ordinary day this route carried nearly 100,000 cars.
But if you compare these two pictures, there’s not much difference. If anything there’s a lot more “green” on Tuesday’s traffic charts than on a typical day. But that was mid-morning. Surely things would reach epic proportions by 5pm. So here are the “typical” and actual charts for traffic in downtown Seattle for Tuesday at 5pm.
It’s clearly more congested than it was in the morning, but a high fraction of streets, especially those North and South of Downtown have visibly more green than on a typical weekday.
It may seem like a stretch to suggest that closing the Alaskan Way viaduct actually made traffic conditions in Seattle better, but in some respects, thats likely to be the case. Worried about getting caught in a traffic jam, it’s likely that many travelers postponed or re-rerouted their trips. If closing the viaduct reduces the number of trips to downtown Seattle, it reduces traffic on other streets as well.
What road closures teach us about travel demand
So what’s going on here? Arguably, our mental model of traffic is just wrong. We tend to think of traffic volumes, and trip-making generally as inexorable forces of nature. The diurnal flow of 100,000 vehicles a day on an urban freeway the Alaskan Way viaduct is just as regular and predictable as the tides. What this misses is that there’s a deep behavioral basis to travel. Human beings will shift their behavior in response to changing circumstances. If road capacity is impaired, many people can decide not to travel, change when they travel, change where they travel, or even change their mode of travel. The fact that Carmageddon almost never comes is powerful evidence of induced demand: people travel on roadways because the capacity is available for their trips, when when the capacity goes away, so does much of the trip making.
If we visualize travel demand as an fixed, irreducible quantity, it’s easy to imagine that there will be carmaggedon when a major link of the transportation system goes away. But in the face of changed transportation system, people change their behavior. And while we tend to believe that most people have no choice and when and where they travel, the truth is many people do, and that they respond quickly to changes in the transportation system. Its a corollary of induced demand: when we build new capacity in urban roadways, traffic grows quickly to fill it, resulting in more travel and continuing traffic jams. What we have here is “reduced demand”–when we cut the supply of urban road space, traffic volumes fall.
If Seattle can survive for a couple of weeks without a major chunk of its freeway system, that’s a powerful indication that more modest steps to alter road capacity don’t really mean the end of the world. If we recognize that traffic will tend to adjust to available capacity, we then end up taking a different view of how to balance transportation against other objectives. For example, this ought to be a signal that road diets, which have been shown to greatly improve safety and encourage walking and cycling, don’t have anything approaching the kinds of adverse effects on travel that highway engineers usually predict. So in the next few weeks, keep an eye on Seattle: If the one of the nation’s most bustling cities can survive the loss of a freeway segment that carries a hundred thousand vehicles a day, its a strong sign that more modest changes to road systems really don’t have much impact on metropolitan prosperity.
Carmaggedon never comes
Of course, we’ll wait for detailed data on traffic conditions that will be collected over the next few weeks before making a definitive judgment. But this phenomenon of reduced demand is so common and well-documented that it is simply unremarkable. Whether it was Los Angeles closing a major section of freeway to replace overpasses, or Atlanta’s I-85 freeway collapse, or the I-35 bridge failure in Minneapolis, or the demolition of San Francisco’s Embarcadero Freeway, we’ve seen that time and again when freeway capacity is abruptly reduced, traffic levels fall as well.
LOS ANGELES: One of the most famous instances of this phenomena was in Los Angeles. In 2011 and 2012, the state highway department closed a 10 mile stretch of Interstate 405 on several weekends to rebuild overpasses. The media was awash in predictions of Carmaggedon. But surprisingly, nothing of the kind happened. As Brian Taylor and Martin Wachs explain in an article in Access, people mostly avoided taking trips in the area, or chose alternate routes, with the effect that traffic was actually much lighter than normal. They report that “Rather than creating chaos, the first closure greatly reduced traffic congestion.” Taylor and Wachs explain that “crying wolf” about likely gridlock depressed trip-taking in the affected area, but that effect faded as travelers realized things were nowhere as bad as predicted.
MINNEAPOLIS: You might think that the kind of behavioral effects that keep Carmaggedon at bay only work when its a short closure of a few hours. But even the year-long closure of I-35W in Minneapolis, following the collapse of a highway bridge over the Mississippi in 2007 produced similar results. Travelers quickly changed their routes and travel times, and many people simply stopped taking trips that crossed the river. David Levinson reports that there were about 46,000 fewer trips per day across the river after the bridge collapsed.
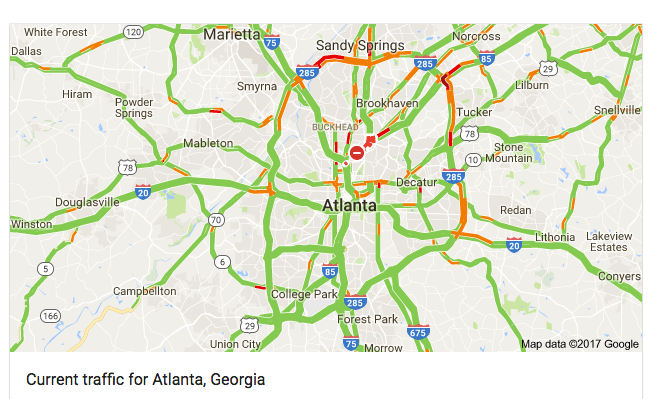
ATLANTA: In April 2017, a spectacular fire destroyed several hundred feet of Interstate 85 in Atlanta, on a segment of roadway carrying nearly a quarter million cars per day, causing newspapers to say “Atlanta to face travel chaos for MONTHS.” Yet the first commuting day after the collapse, April 3, 2017, the Atlanta Journal Constitution reported: “Atlanta I-85 collapse: The word on Monday’s commute? Not so horrible.” And Google Maps showed that late in the morning, traffic looked pretty normal:
Why Carmaggedon never comes (Seattle edition)
Why predicted gridlock almost never happens and what this teaches us about travel demand
Seattle has finally closed its aging Alaskan Way viaduct, a six-lane double-decker freeway that since the 1940s has been a concrete scar separating Seattle’s downtown from Elliott Bay. In a few weeks, much of this capacity will be replaced by a new 3 billion dollar highway tunnel under downtown Seattle, but until then, the city will have to simply do without a big chunk of the highway system that circulates cars around downtown Seattle.
Transportation agencies and the media love to portray major road closures as the real world equivalents of disaster films. The City of Seattle has even come up with its own ominous moniker THE PERIOD OF MAXIMUM CONSTRAINT, which it says, “sounds like a summer action blockbuster starring Will Smith.”
Losing a major freeway that carries nearly hundred thousand vehicles a day through the heart of the city will certainly cause a major disruption to the traffic. The Seattle Times confidently told its readers in early January to prepare for a traffic cataclysm: “the region can’t absorb the viaduct’s 90,000 daily vehicle trips and 30,000 detoured bus riders without traffic jams that likely will ripple out as far as [distant suburbs] Woodinville or Auburn.” Our friends at CityLab echoed the ominous rhetoric with a story headlined “Viadoom: Time for the Seattle Squeeze Traffic Hell.”
That’s pretty scary stuff. But two days into Seattle’s brush with carmaggedon how are things looking?
Well, see if you can tell. Here are the Google maps for traffic conditions on a typical day and post-viaduct closure. This first pair of charts shows conditions in mid-morning on Tuesday, January 15th. On the left is Google’s map of typical traffic levels on a Tuesday morning at 10:20 am, using Google’s familiar color-coded congestion rankings (green is moving smoothly, yellow is slowing, red is stop and go). On the right is Google’s real time traffic map of downtown Seattle for Tuesday, January 15th (day two of THE PERIOD OF MAXIMUM CONSTRAINT). You can spot one big difference right away. The right-hand map shows the closed portion of the viaduct shows up as a series of dotted red lines, punctuated with red and white “do not enter symbols” showing closed ramps to and from the viaduct. On an ordinary day this route carried nearly 100,000 cars.
But if you compare these two pictures, there’s not much difference. If anything there’s a lot more “green” on Tuesday’s traffic charts than on a typical day. But that was mid-morning. Surely things would reach epic proportions by 5pm. So here are the “typical” and actual charts for traffic in downtown Seattle for Tuesday at 5pm.
It’s clearly more congested than it was in the morning, but a high fraction of streets, especially those North and South of Downtown have visibly more green than on a typical weekday.
It may seem like a stretch to suggest that closing the Alaskan Way viaduct actually made traffic conditions in Seattle better, but in some respects, thats likely to be the case. Worried about getting caught in a traffic jam, it’s likely that many travelers postponed or re-rerouted their trips. If closing the viaduct reduces the number of trips to downtown Seattle, it reduces traffic on other streets as well.
What road closures teach us about travel demand
So what’s going on here? Arguably, our mental model of traffic is just wrong. We tend to think of traffic volumes, and trip-making generally as inexorable forces of nature. The diurnal flow of 100,000 vehicles a day on an urban freeway the Alaskan Way viaduct is just as regular and predictable as the tides. What this misses is that there’s a deep behavioral basis to travel. Human beings will shift their behavior in response to changing circumstances. If road capacity is impaired, many people can decide not to travel, change when they travel, change where they travel, or even change their mode of travel. The fact that Carmageddon almost never comes is powerful evidence of induced demand: people travel on roadways because the capacity is available for their trips, when when the capacity goes away, so does much of the trip making.
If we visualize travel demand as an fixed, irreducible quantity, it’s easy to imagine that there will be carmaggedon when a major link of the transportation system goes away. But in the face of changed transportation system, people change their behavior. And while we tend to believe that most people have no choice and when and where they travel, the truth is many people do, and that they respond quickly to changes in the transportation system. Its a corollary of induced demand: when we build new capacity in urban roadways, traffic grows quickly to fill it, resulting in more travel and continuing traffic jams. What we have here is “reduced demand”–when we cut the supply of urban road space, traffic volumes fall.
If Seattle can survive for a couple of weeks without a major chunk of its freeway system, that’s a powerful indication that more modest steps to alter road capacity don’t really mean the end of the world. If we recognize that traffic will tend to adjust to available capacity, we then end up taking a different view of how to balance transportation against other objectives. For example, this ought to be a signal that road diets, which have been shown to greatly improve safety and encourage walking and cycling, don’t have anything approaching the kinds of adverse effects on travel that highway engineers usually predict. So in the next few weeks, keep an eye on Seattle: If the one of the nation’s most bustling cities can survive the loss of a freeway segment that carries a hundred thousand vehicles a day, its a strong sign that more modest changes to road systems really don’t have much impact on metropolitan prosperity.
Carmaggedon never comes
Of course, we’ll wait for detailed data on traffic conditions that will be collected over the next few weeks before making a definitive judgment. But this phenomenon of reduced demand is so common and well-documented that it is simply unremarkable. Whether it was Los Angeles closing a major section of freeway to replace overpasses, or Atlanta’s I-85 freeway collapse, or the I-35 bridge failure in Minneapolis, or the demolition of San Francisco’s Embarcadero Freeway, we’ve seen that time and again when freeway capacity is abruptly reduced, traffic levels fall as well.
LOS ANGELES: One of the most famous instances of this phenomena was in Los Angeles. In 2011 and 2012, the state highway department closed a 10 mile stretch of Interstate 405 on several weekends to rebuild overpasses. The media was awash in predictions of Carmaggedon. But surprisingly, nothing of the kind happened. As Brian Taylor and Martin Wachs explain in an article in Access, people mostly avoided taking trips in the area, or chose alternate routes, with the effect that traffic was actually much lighter than normal. They report that “Rather than creating chaos, the first closure greatly reduced traffic congestion.” Taylor and Wachs explain that “crying wolf” about likely gridlock depressed trip-taking in the affected area, but that effect faded as travelers realized things were nowhere as bad as predicted.
MINNEAPOLIS: You might think that the kind of behavioral effects that keep Carmaggedon at bay only work when its a short closure of a few hours. But even the year-long closure of I-35W in Minneapolis, following the collapse of a highway bridge over the Mississippi in 2007 produced similar results. Travelers quickly changed their routes and travel times, and many people simply stopped taking trips that crossed the river. David Levinson reports that there were about 46,000 fewer trips per day across the river after the bridge collapsed.
ATLANTA: In April 2017, a spectacular fire destroyed several hundred feet of Interstate 85 in Atlanta, on a segment of roadway carrying nearly a quarter million cars per day, causing newspapers to say “Atlanta to face travel chaos for MONTHS.” Yet the first commuting day after the collapse, April 3, 2017, the Atlanta Journal Constitution reported: “Atlanta I-85 collapse: The word on Monday’s commute? Not so horrible.” And Google Maps showed that late in the morning, traffic looked pretty normal:
Related Commentary