We have the data: Let’s do a real test of whether Uber and Lyft lead to more crashes
Last year, we asked some hard questions about a study from the University of Chicago’s Booth School of Business that made the provocative claim that the advent of ride-hailing services like Lyft and Uber has actually led to an increase in car crashes, and related injuries and deaths. In our view, the study was based on highly aggregated data, and was likely a spurious correlation, because it didn’t control for changes in gas prices, and used very crude measures of ride hailing activity. We challenged the authors of the study to do a more detailed analysis, correlating the time and location of increased crashes to the times and places where ride-hailed vehicles are most used.
The paper, The Cost of Convenience: Ridesharing and Traffic Fatalities, is written by John Barrios of the University of Chicago and Yael V. Hochberg and Livia Hanyi Yi of Rice University. It looked at the roll-out of ride hailing services to different cities and changes in local crash rates. The key method behind the study is a “difference in difference” analysis of crash trends across cities. The authors basically look at the date at which Uber and Lyft introduced their services in different cities and look to see if there’s any correlation between the addition of service and a change fatality rates. It finds that there has been a positive correlation between these two events. They conclude that the advent of ride-hailing is associated with about a 2-3 percent increase in fatal crashes. Their paper argued that ride-hailing has increased vehicle miles traveled, and therefore led to more crashes.
In our commentary last October, we expressed skepticism about these findings. Trying to draw inferences based on the number of months since ride-hailing was introduced in the market and regionwide crash rates is a crude and potentially flawed way of judging whether ride-hailing affects crashes. Notably, we pointed out that:
- The study leaves out the effect of lower gas prices and increased driving on crash rates.
- Rural areas–which essentially don’t have ride-hailing services–saw even bigger increases in crashes than cities with ride-hailing.
- And the study doesn’t try to correlate the increase in crashes to either the times or the places that ride-hailed vehicles are most used, which would be a much more powerful indicator of a safety effect.
The report has generated a steady stream of uncritical media coverage (for example: Business Insider and CityLab) and regular tweets repeating its key claims. The study was even written up in Science magazine (which also cited City Observatory’s skepticism about the results).
Arguably, in the case of their original work, the kind of detailed data about the time and location of ride-hailed trips wasn’t available when they wrote their paper. It is now, and it’s right in their own backyard. The City Of Chicago has released several gigabytes of data on ride hailing activity in the city, showing the time of day, day of week, and beginning and end points of rides. This is exactly the kind of data that’s needed to resolve any doubts about the impact of ride-hailing on crashes.
Let’s Correlate Crash Times and Locations to Uber and Lyft Trips
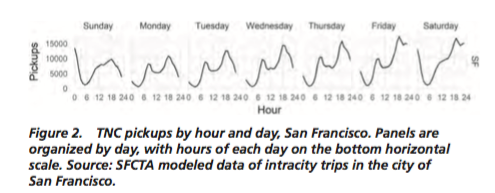
Exploiting the rich variation in the time and location of ride-hailed trips will provide a much clearer statistical picture than a time series analysis of region-wide data. Ride hailing trips are heavily concentrated in time (peak hours, and weekend nights) and in space (in downtown areas and near airports). We reviewed a very detailed five city study on this in our commentary “Drinking,Flying, Parking, Peaking, Pricing.” As the report illustrates, there’s a strong pattern to ride-hailing use by time of day and day of week:
One of the most valuable aspects of crash data is that it is coded with the exact date, time and location at which a crash occurs. There’s copious, publicly available data on crashes for the City of Chicago. Given that the Chicago ride-hailing dataset provides similar detail about the time and location of ride-hailing activity, it should be possible to do a much more precise analysis of the correlation between ride-hailing and crashes than aggregating data at the city level by month or year.
For example, if the thesis of the Barrios-Hochberg-Yi paper is correct, and ride-hailing contributes to increased crashes, it ought to be correlated with the days of the week, times of the day, and locations at which ride-hailed vehicles are most present. For example, a high proportion of all ride-hailed trips occur on Friday and Saturday nights, while only tiny fractions of such trips are taken on mid-days on Tuesdays and Wednesdays. If ride-hailing were responsible for increased deaths, one would expect most of the increase to occur on those times when it was most active.
Similarly, ride-hailing activity is highly concentrated in city centers, and secondarily in and around airports. This pattern has much to do with the fact that parking is priced in cities, and that travelers to and from airports may not own a car in the city in which they are traveling, or find it expensive or inconvenient to rent or park one. Again, if our hypothesis is that ride-hailing has increased crashes, we would expect to find more crashes in those places in which ride hailing was prevalent, and expect no increase or a smaller increase in crashes where ride hailing was rare (i.e. low density suburbs).
As we said last October,
“More analysis is needed. . . . we need to make much better use of the detailed temporal and locational data on crashes and determine whether there’s any connection between the times and places where ride-hailing is most used and the increase in crashes.”
The data is now available: We call on Barrios, Hochberg and Yi to download this data, and data for Chicago area crash reports, and take a closer look at this question. If their original hypothesis is correct, they should easily be able to verify it with this data. If not, they should let everyone know. We’ll look forward to what they find. Until then, we think it would be a good idea to suspend judgment on whether we think ride-hailing is causing crashes.
