It’s an eye-catching, convention-tweaking claim: We’ve reached peak Millennial. And, so the argument goes, because Millennials have hit their “peak,” it’s time to junk all these crazy theories about Millennials not wanting to own cars, and not buying homes, especially in the suburbs. Sure, they had a youthful dalliance with city living, and the numbers of city-dwellers was temporarily pushed up by the now receding demographic wave, but now city living is now bound for a fall.
That, in a nutshell, is the argument being made by USC Professor Dowell Myers, who made the “peak Millennial call” in a lecture at the University of Texas in February. His argument was picked up and amplified by the Kinder Institute in “What if City-Loving Millennials Are Just a Myth?”, and most recently echoed by CityLab’s “Have U.S. Cities Reached ‘Peak Millennial’?
Have we hit peak Millennial? Does “peak Millennial” actually mean anything? Are we looking at a demographic ebb-tide for city living?
As it turns out, the answer to all of these questions is no.
We’ll explain the answers at greater length below, but the short synopsis is this:
The roughly 75-million-person group often called “Millennials” (those born 1980 to 1999) are now between 15 and 34 years of age. Just this year, for the first time, these Millennials made up 100 percent of those persons aged 25-34 (the age cohort that’s been fueling city growth). The number of 25 to 34 year-olds (all Millennials) will continue to increase from now through 2024, growing from 44.1 million to 47.6 million. Their impact on housing markets, in particular, is only beginning to be felt, and will grow in the decade ahead.
There’ll be more 25-to-34-year-old Millennials Every Year through 2024
Let’s start at the beginning. The core claim about the “peak” made by Professor Myers is based on one factoid: the highest number of births recorded in any year of the Millennial generation (those born between 1980 and 2000) occurred in 1990. The number of Millennials born in years after 1990 declines (slightly). So, by Myer’s math, the number of Millennials turning 25 has peaked in 2015. Myers core graph—reproduced here from Ryan Holyfield’s Kinder Institute blog, has a peculiar representation of the Millennial “peak.”
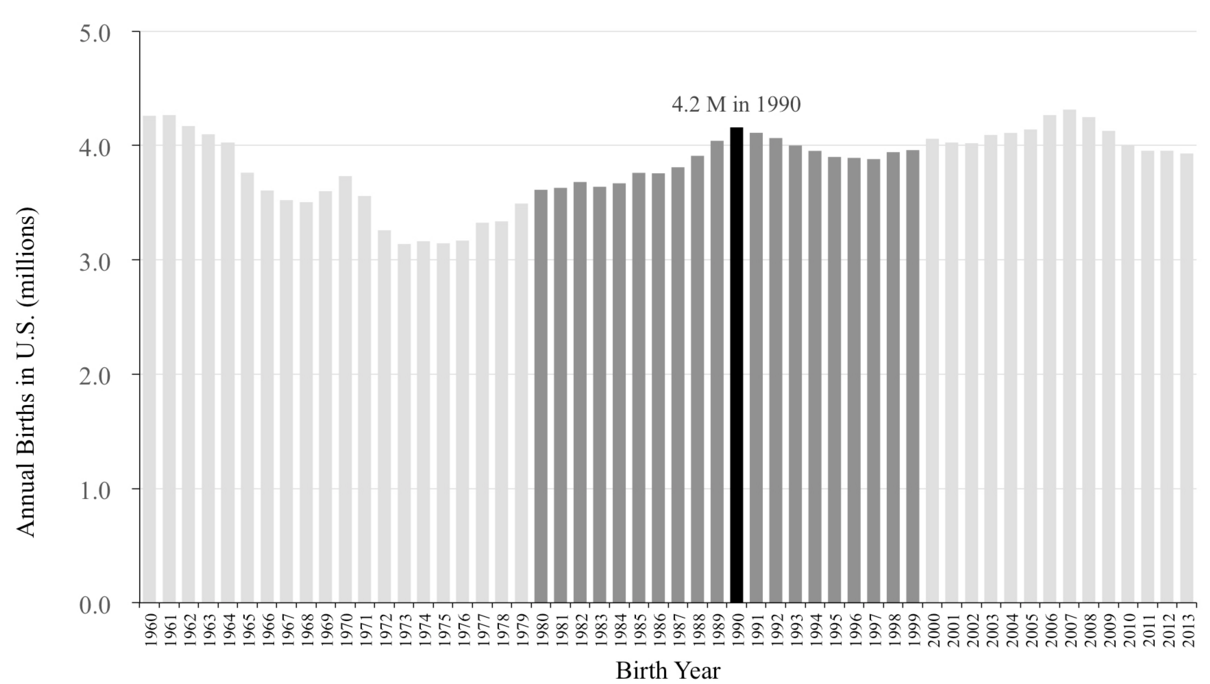
What it shows is the number of births in the US in each year from 1960 to 2013. Between 1980 and 2000, there’s a very soft peak in 1990, when 4.2 million people were born, as compared to an average of 3.8 million over the rest of the period. The people born during that soft peak turned 25 last year, which is what Myers is referring to as “peak Millennial.”
But why Myers picked age 25 to represent the “peak” of anything is unclear. For most young adult Americans, 25 is just the age where most (though not all) have finished their formal education, fewer than half have married, and most still don’t have children. It may be for some the end of an extended adolescence, but for most it’s essentially early onset adulthood.
More importantly, one year is never representative—it’s better to look at a larger age cohort. So as we go forward with our analysis, we’ll look at a 10 year wide age cohort, and lean on the Census Bureau’s forward-looking projections of the US young adult population. And in fact, we think it’s much more useful to talk about specific age cohorts (persons 25 to 34) than it is to talk about birth cohorts (those born in a particular time period), especially in undertaking time series analysis of economic trends. As we pointed out in our commentary debunking the National Association of Realtors claims about home buying trends, trying to deduce inter-generational changes by comparing Millennials when they are very young to those same people when they are older, inherently produces misleading results.
At City Observatory, we’ve focused keenly on the key 25- to 34-year-old age group. They’re highly mobile, likely to change jobs and homes, have generally completed their education, and have what economists would call “recent vintage human capital.” For all these reasons—and because they generally command lower wages than more experienced workers—they compose the dream demographic of fast-growing companies. They’re the most likely to move across state lines, and their migration decisions play a disproportionate role in determining which places experience a brain gain, as opposed to a brain drain.
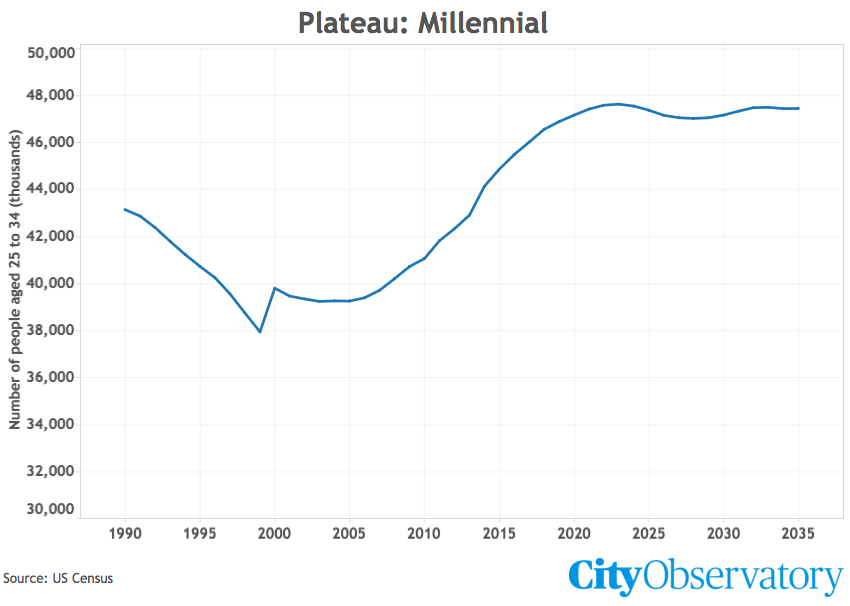
What’s interesting is that in 2015—for the first time—Millennials (those born between 1980 and 2000) constitute all of the persons aged 25-34. At the time of the last decennial census (2010), about half of the 25- to 34-year-old age group was composed of people in the tail end of generation X, and half were the early wave of Millennials. So strikingly, what the Census data shows is that the total number of 25 to 34 year olds in the US will increase from now through 2024. This chart shows the Census Bureau’s estimates of population aged 25 to 34 based on historical data through 2014 and its projections through 2035.
During the 1990s the number of 25 to 34 year olds actually declined as Baby Boomers aged out of this age group and were gradually replaced by the numerically smaller Generation X. .Between 2000 and 2010 the number of gen xer 25 – 34 year-olds increased slowly, with all of the aggregate increase in this age group being recorded after 2008. So, to the extent there was a movement back to the city in the 1990s, and the first half of the 2000-2010 decade, it was propelled not by an aggregate increase in the number of 25-to-34 year olds in the nation, but the changing relative preference of young adults for urban locations.
So, what we—and others—have recorded as the movement of young adults back into cities has, until very recently, little to do with the preferences of the Millennial generation. In fact, as they turn 25, and as they now dominate this age cohort, the next decade will be the time when the Millennial generation’s effect on cities will be most fully felt. Rather than declining, the number of 25-to 34 year olds in the United States will increase each year from now through 2024, rising from 44.1 million in 2015 to 47.6 million in 2024. In reality, the Millennial wave of urbanism is just now hitting the beach.
The outlook after 2024 (when the 25-34 year olds will increasingly be “post-Millennials”) is not for a dramatic demographic collapse. Rather than a peak, the young adult population stabilizes at a fairly high plateau above 47 million 25 to 34 year olds through 2035. So there is little basis for forecasting a decline in the key population group that has driven urban growth.
The Preference of Young Adults for Urban Living is Increasing
As far as cities and city living are concerned, we’re just now seeing the full impact of Millennials in this key 25-34 year old age group. And the 25 to 34 year old age group will be composed entirely of Millennials for the next decade (and then the oldest Millennials (those born in the late 1990s) will age out of this young adult category in the early 2030s. So Millennials and their preferences—whatever they are—will essentially determine the behavior of the “young adult” demographic for the next 15 years, or so.
While it’s fashionable to describe the trend toward city living as something caused by the unique preferences of Millennials, the shift toward city living both predates the maturation of the Millennial generation—and promises to continue as their places among the young adult age group are taken by the post-Millennials (or whatever name is attached to the succeeding generation).
The relative preference for urban living for 25 to 34 year-olds has been increasing over the past two decades.
- 1980: 10 percent
- 1990: 12 percent
- 2000: 32 percent
- 2010: 51 percent
(These figures are drawn from Table 5 of our Young and Restless report; we’ve computed relative preference by dividing the probability that a person aged 25 to 34 lives within a three-mile radius of the center of the CBD of one of the 51 largest metropolitan areas, and compared it to the probability that the average resident of a metropolitan area live in this radius. If 11 percent of 25 to 34 year olds live in the 3 mile radius, and 10 percent of the population as a whole lives inside that radius, the relative preference is 10 percent (11 percent/10 percent)=110 percent, meaning that a 25 to 34 year old is 10 percent more likely than the typical resident to live in this area.
Interestingly, the relative preference of young adults for urban living tripled during the 1990s—a time when the total number of 25- to 34-year olds was actually in decline in the US (down about 7.7 percent). And even though the number of 25- to 34- year olds was increasingly only slowly during the decade 2000 to 2010 (+3.2 percent), the preference for urban living grew substantially. In the coming decade (2015-2025) the size of the 25-34 year will growth by 7.7 percent.
Far from peaking, the Millennial generation is hitting the sweet-spot for urban living, plus their numbers will continue to grow, according to the Census, between now and 2024.
The implication of the Myers analysis is that the growth in urban living is tied somehow to the size of the Millennial generation rather than its growing relative preference for urban living. His thesis is that as the number of persons turning 25 declines by about 400,000 this will lead to a reduced number of Millennials moving to cities. But as the evidence of the 1990s shows, it’s entirely possible to see as sustained decline in the numbers of young adults and also to observe an increase in the relative preference of those young adults for urban living.
The Takeaway: More Young Adult Urban Growth is Coming
The number of 25 to 34 year olds—the key group driving urban living, will not decline, but will growth between now and 2024. The urban wave we’ve experienced starting in the 1990s, and accelerating in the past decade wasn’t propelled by generational growth, so much as by a growing preference for urban living by young adults.
Data Notes
The Census data for our of estimates of the 25 to 34 year old population come from three sources. Data for the period prior to 2010 comes from the archive of historical Census population estimates (https://www.census.gov/popest/data/historical/index.html).
Data for the period 2011 to 2014 comes from Annual Estimates of the Resident Population for Selected Age Groups by Sex for the United States, States, Counties, and Puerto Rico Commonwealth and Municipios: April 1, 2010 to July 1, 2014, Source: U.S. Census Bureau, Population Division, Release Date: June 2015. See: https://www.census.gov/popest/data/. Census projections of the population by year and age for the period 2015 through 2035 come from the 2014 Census Population Estimates series http://www.census.gov/population/projections/data/national/2014.html.
* Note the discontinuity in the data between 1999 and 2000 reflects the disparity between the Census Bureau’s annual intercensal estimates of the 25-34 year-old population and the actually higher number of 25-34 year olds enumerated by the 2000 decennial Census. It’s likely that the actual number of 25-34 year olds was underestimated in the intercensal estimates, during a period of significant immigration).
