Growing supply is producing growing vacancies and easing rents
There’s been a lot of skepticism expressed as to whether supply and demand are actually at work in the housing market. We’ve been strong believers that the economic perspective is fundamentally sound: rent hikes over the past few years have been the product of demand outstripping supply, and as supply catches up, we can expect rents to abate. When it comes to housing, there is a classic “temporal mismatch” between demand and supply: demand can change quickly as more people move to an area, jobs and wages increase, and the popularity of city living or particular neighborhoods increases. These changes can happen almost overnight. It takes much longer–years–to plan, finance and build new housing.
At City Observatory, we pay close attention to our backyard: Portland, Oregon. Here, until just a little over a year ago, rents were increasing sharply. In response to public outcry, the City Council enacted an inclusionary housing requirement (in our view, ill-advised). The Legislature considered authorizing local governments to impose rent control. But in the mean time, the market has been responding. Lots of new apartments have been constructed in Portland, and they are steadily being completed, and coming on to the market.
The result, as we explored last fall, is a profusion of something that had rarely been seen on Portland streets: For Rent signs. We recently updated our sidewalk survey of the rental market during a short trek around Northeast Portland. There are an abundance of rentals available.
[table id=13 /]
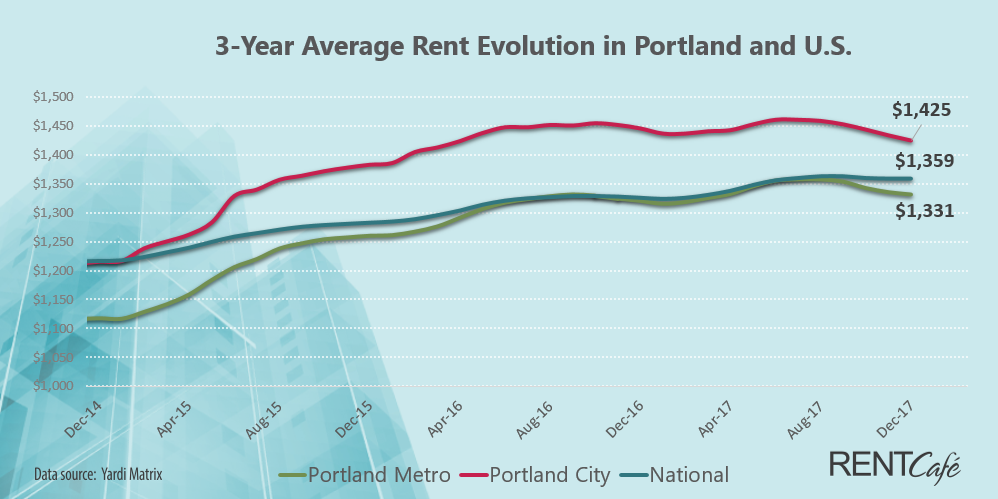
This overhang of vacancies puts pressure on landlords to ask for lower rents. Some units are offering several months free rent to new tenants. And gradually, this process is spilling over into measured rents. This week we have new data from RentCafe–which gets its data from the Yardi real estate company–showing actual year-over-year declines in rents in Portland, down by their estimate 1.2 percent over the past twelve months in the city.
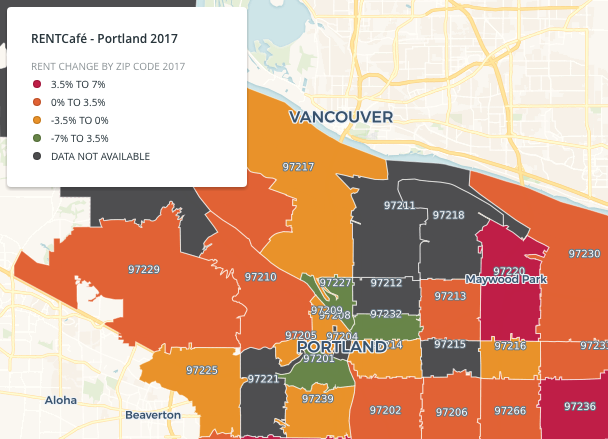
And their neighborhood data show even more significant declines in some of the city’s hottest close-in neighborhoods (where much of the demand and new construction has been focused.) A total of 11 Portland ZIP codes have seen their average rents decrease. According to Rent Cafe, ZIP code 97227 covering parts of the Eliot and Overlook neighborhoods posted the steepest decrease rate, rents there are 6.8% lower than a year ago. (Green and orange zip codes on this map experienced year over year declines in average rents, according to RentCafe).
This is, of course, just one firm’s estimate of the state of the housing market. At City Observatory, we’ve been cautious to put too much reliance on widely published rental price indices. Despite its many merits, RentCafe lacks data for several neighborhoods, including zip code 97212, where all of the “for rent” signs illustrated above are posted. At this point, we take the RentCafe data as just one more sign that supply and demand are starting to come into balance. We’ll continue to track this market using other indicators in the months ahead.
