One trend we’ve tracked at City Observatory has been the movement of jobs back to city centers. While there are an increasing number of examples of prominent firms moving downtown — GE abandoning its suburban campus for a location in Boston’s Seaport district, McDonalds moving from Oak Brook to a site near Chicago’s Loop — we’re interested in broader economic data that shed light on the strength and persistence of this trend.

In our report, Surging City Center Job Growth, we’ve used data from the Census Bureau’s Local Employment and Housing Dynamics (LEHD) dataset to track neighborhood level changes in employment patterns in large US cities. These data confirm, that for most large cities for which reliable data is available, that job growth has slowed on the urban periphery and accelerated in urban centers.
A new paper from Nathaniel Baum-Snow and Michael Hartley provides some interesting data on the geographic patterns of employment change within U.S. cities. While the paper is primarily focused on the demographics of neighborhood change, it looks in part at how changing job growth patterns may have influenced population location. Analyzing data for 120 large US metropolitan areas for the two decades 1990 to 2010, Baum-Snow and Hartley compute the rate of employment growth by distance to the center of the central business district.
The following chart shows employment growth rates for two decade-long periods, 1990 to 2000 and 2000 to 2010. The vertical axis shows the percentage increase in employment over the decade (shown as a decimal, so .10 = 10%). The horizontal axis shows the distance from the center of the central business district in kilometers (0 kilometers is the center of the CBD). The values reported are the median percentage increase in employment for the 120 metropolitan areas covered, and so represent the experience of the “middle” metropolitan area in this group (not a population or employment-weighted median).
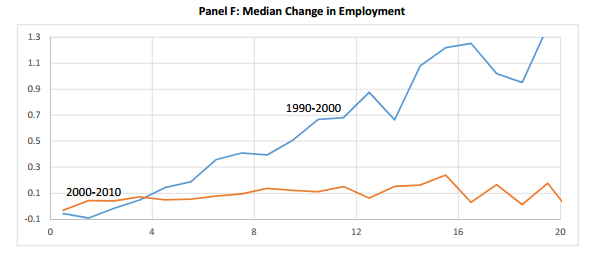
There’s a stark difference between the two decades. At first, the suburbanizing, decentralizing pattern of employment growth was very much in evidence. In the 1990s, the further you went from the urban core, the faster jobs were growing. Within 2 kilometers (1.2 miles of the center), job growth was, in the typical metropolitan area declining. Beyond 15 kilometers (about 9 miles) the total number of jobs more than doubled during the decade (i.e. and increase of more than 100 percent over the decade).
More recently, that decentralizing trend is disappeared. Between 2000 and 2010, job growth was nearly the same regardless of distance to the central business district. Within four kilometers of the CBD, employment growth improved compared to the 1990s; beyond four kilometers, employment growth was much slower than in the 1990s.
The dramatic flattening of the employment growth curve over the last decade is evidence that the historic pattern of steady employment decentralization has, at least for the time being, ground to a halt. These data confirm that over the last decade, city centers have dramatically improved their economic performance relative to suburbs. We’ll keep following this and other data, to see where this trend leads.
