One of the cleverest adaptations of web-technology is the development of crowd-sourced funding for new products and business ideas. The biggest of these crowd-sourced funding platforms is Kickstarter, which since its launch in 2009, has generated funding for ideas like the pebble smartwatch, the “coolest” cooler and a revival of the Mystery Science Theater 3000 television series. Most Kickstarter campaigns are for relatively small amounts, raising between $1,000 and $10,000 and are popular ways of raising funding for creative projects ranging from music albums and films to games and art. Since its inception, Kickstarter has raised more than $2.6 billion for more than 112,000 projects.
The website Polygraph.cool has used data on the location and industry of Kickstarter campaigns to create a city by city, industry-by-industry visualization of these business plans. Using data from more than 90,000 Kickstarters, their interactive infographics display the relative size of the campaign (based on money pledged to each project), and projects are color coded by industry (music, film and video, design, publishing, art, theater and games, among other categories).
In these diagrams, the overall size of each cities constellation of dots corresponds to the volume of funding raised via Kickstarter, and the size of each dot represents the value of pledges. The concentration of colors of each diagram is indicative of the industrial focus of Kickstarter campaigns in that city. You can mouse over any dot on the diagram to see details on the particular project.
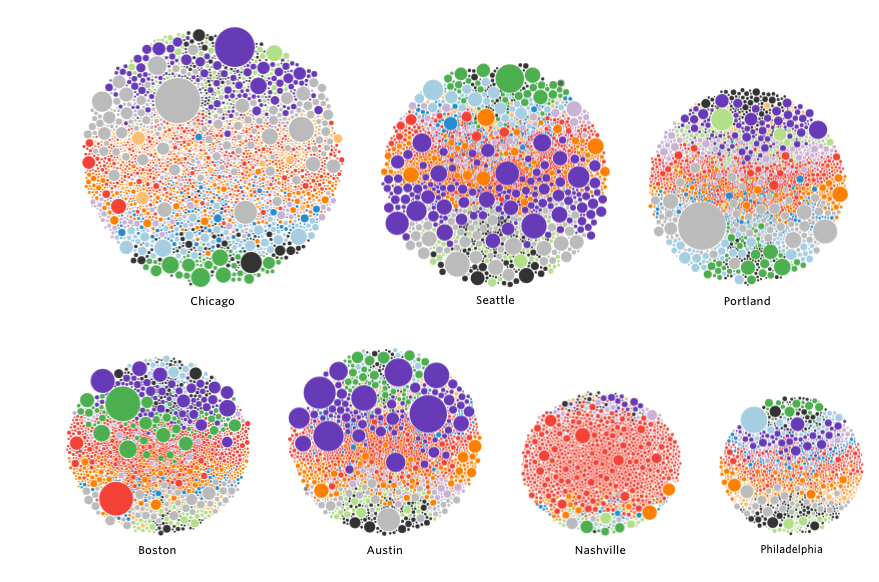
Not surprisingly, the nation’s largest metro areas (New York and Los Angeles) account for the largest number of Kickstarter campaigns. New York has more than 11,000 Kickstarters; Los Angeles has more than 8,000. The campaigns in some cities are heavily skewed toward local industrial specializations–Nashville’s for example, consists mostly of music projects (the red dots in the chart above). Its worth exploring the infographics for different cities to see the number and variety of projects funded in different locations.
At City Observatory, we focus on metropolitan areas, so we’ve tabulated Polygraph.cool’s Kickstarter data by metro area (aggregating multiple cities within a metro, such as Tempe and Scottsdale along with Phoenix, and Cambridge and Lawrence along with Boston). To get an idea of the relative importance of Kickstarter to each metro economy, we’ve computed the number of Kickstarter campaigns in each metropolitan area per 10,000 population. As you can see, there’s wide variation among metropolitan areas.
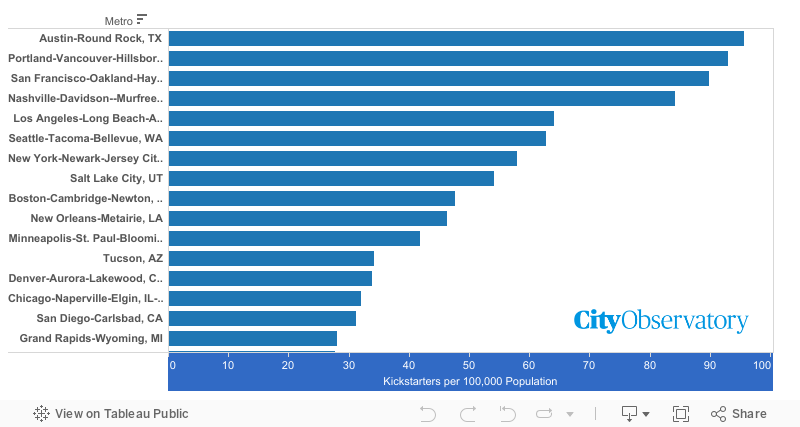
Perhaps unsurprisingly, many of the usual suspects of the creative economy show up at the top of the chart. On a per capita basis, Austin, Portland and San Francisco have the highest number of Kickstarter campaigns, with between 80 and 100 campaigns per 100,000 population. Among metropolitan areas with one million or more population, the median metropolitan area has about 20 campaigns per 100,000 population. The metro areas with the fewest Kickstarter’s per capita include Riverside, Virginia Beach and Hartford, each of which have fewer than 8 campaigns per 100,000 population.
As the authors of the Polygraph visualization note, many of our conventional yardsticks for measuring the creative economy are dominated by data sources that capture large scale enterprises, but not grass roots and D-I-Y activities. Because Kickstarter has few barriers to entry, and is accessible even to individual artists, its one way to measure creative efforts that simply don’t show up in other sources. So have a look at the Kickstarter data for your city, to see how it stacks up.
