Yesterday, we introduced three kinds of economic segregation, and how you might measure each: the proportion of people in high-income neighborhoods; the proportion of people in low-income neighborhoods; and the proportion of people in either high- or low-income neighborhoods.
Each says something important about how people are sorted by income in a metropolitan area. But these measures also miss some things. For one, they don’t reflect how segregated people in the middle of the income spectrum are—whether working-class and upper-middle-class people live in the same neighborhoods, for example.
More subtly, but importantly, these measurements are also very sensitive to changes in inequality, even if segregation per se doesn’t change. Imagine that in your metropolitan area, you doubled the income of the richest 20 percent of families, and cut in half the income of the poorest 20 percent. All of a sudden, many more neighborhoods would meet the definitions of “rich” or “poor” according to these measurements, and so they would tell you that segregation had increased. But in fact, nobody actually moved—and the likelihood that, say, someone in the 10th percentile of income was living in the same neighborhood as someone in the 90th percentile didn’t change at all. What changed wasn’t segregation, but inequality.
Which brings us to…
The H index
So Riordan and Bischoff created an index, called H, that takes into account everyone. Unfortunately, unlike the previous three indicators, it doesn’t have an easy lay-person interpretation: it’s just a number, varying between 0 and 1, with larger numbers indicating more segregation. Basically, it works by ranking each family household by income across an entire metropolitan area, and then comparing the distributions of rankings in each neighborhood.
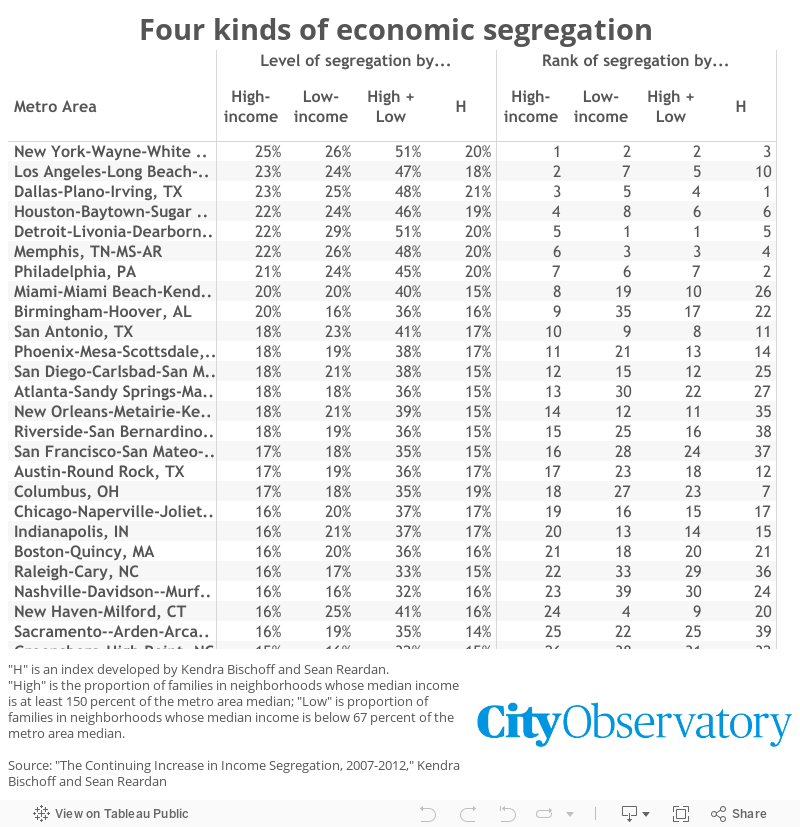
An important thing about H is that it is insensitive to changes in inequality. That is, because it depends on ranks and not actual incomes, if the top 10 percent of families doubled their income, or the bottom 10 percent of families cut their income in half, H would not change, even though there would be important implications for economic segregation. (Presumably we care more about high-end segregation, say, if wealthy people are really wealthy. The less different rich people are from everyone else, the less their separation matters.) In part, this is helpful: it means that an increase in H really tells us something about how people are being sorted into different neighborhoods, and not just a change in income inequality in general. But it also leaves out an important part of the story—just how different high-ranked families are from low-ranked families.
How does H differ from High + Low?
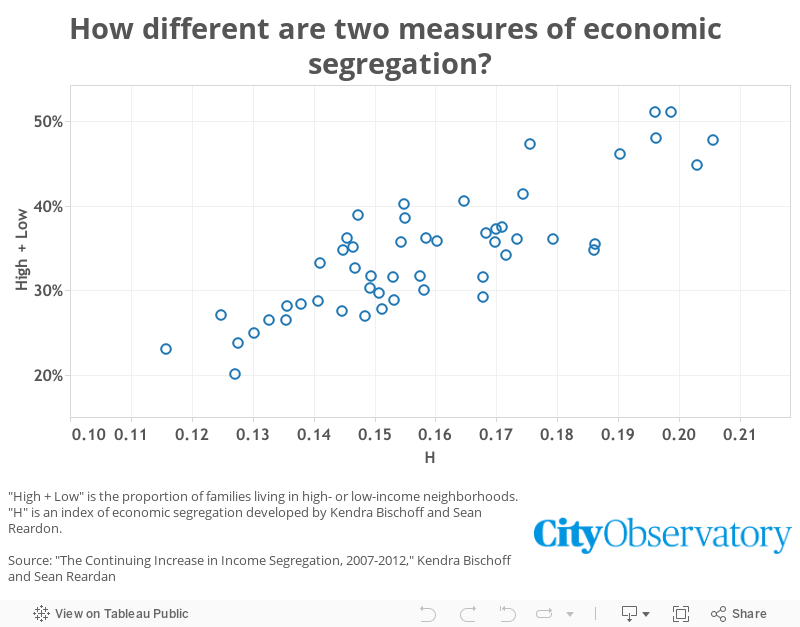
In reality, these two measures are highly correlated, as we might expect. But there are some notable differences. In both San Francisco and Milwaukee, for example, about 35 percent of families live in neighborhoods that are either low-income or high-income. But SF’s H index is 0.14, and Milwaukee’s is 0.19—a very significant jump from the least-segregated third of cities to the most-segregated third. That suggests much more sorting of relatively middle-income families in Milwaukee than San Francisco. It may also suggest that part of San Francisco’s bad showing on the High + Low score is about inequality, rather than segregation—which makes sense if we think that, say, there are many more very high-earning families in the Bay Area than in Milwaukee.
Similarly, Cincinnati and New Orleans score almost identically on the H index, at 0.15. But New Orleans has dramatically more people living in high- or low-income neighborhoods, 39 percent, versus 27 percent in Cincinnati. This is likely because New Orleans has more income inequality than Cincinnati.
In a way, you can think of the H index as a sort of pure description of segregation, while the “High + Low” score captures both segregation and inequality. While we presented that combination as a drawback at the top of this post, it might actually better reflect what many people have in mind when they think about the negative consequences of economic segregation. If harm is caused by extreme neighborhoods—both resource-hoarding rich neighborhoods and opportunity-scarce poor neighborhoods—then it matters how rich the rich are and how poor are the poor.
An increase in the H index might not directly translate to those sorts of ills—rather, it likely suggests that people are increasingly living among people with similar incomes to their own, whether or not they’re creating more rich or poor neighborhoods in the process. That distinction will turn out to be important in our next post about economic segregation: how it’s changing in America today.
