You’re on your couch, streaming the latest episode of Broad City on your Mac laptop, just like a good millennial. But all of a sudden, your wifi connection goes bad, and the screen goes all pixelated. Instead of Abbi and Ilana at an art gallery, all you can see is big blocks of seemingly random color—you know it’s based on what the screen is supposed to look like, but at such a coarse level that it doesn’t actually contain any of the information you’re interested in.

County-level data—at least for some purposes—is a bit like your pixellated screen. Since the Census released its 2015 county-level population estimates last night, we’ve seen a number of analysts try to deduce from them information that they just don’t contain: whether the trend of urban living’s growing popularity is continuing, slowing, or reversing.
To understand why counties aren’t a useful measure for this question, take a look at the following charts, which were put together by Luke Juday at the University of Virginia. They show how demographics have changed in a number of metropolitan areas based on distance from the central business district. But rather than being based on arbitrary, coarse political boundaries—counties or even municipalities—they’re based on Census tracts, which allows for a much finer-grained analysis.
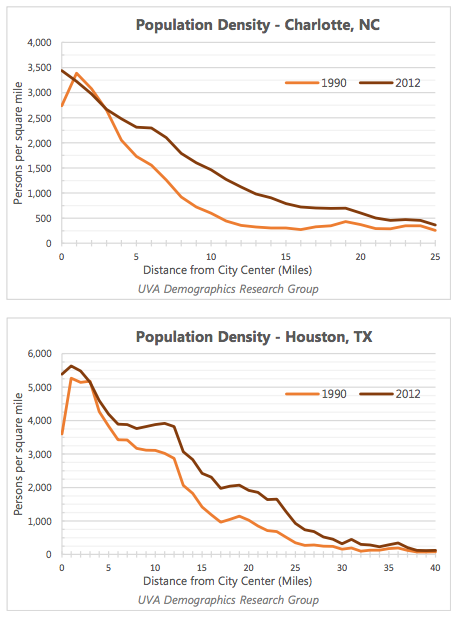
As you can see, there’s a clear trend of growing demand for inner-city living, as represented in this case by growing population density. In many cases, there’s also a counter-trend of decline between that booming inner city and healthier outer suburbs. Using this methodology, those trends are clear as day.
But if you used counties, you would likely be able to detect neither the booming inner cities nor the declining second ring. Why? Because in many cases, both the booming core and the declining second ring are in the same counties.
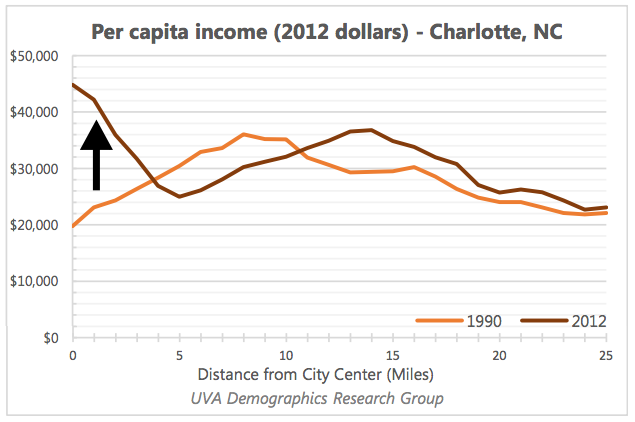
Look at Charlotte, for example. There’s a clear boom in its central city (here depicted by growing income levels) followed by a trough at about five miles out from its CBD. But Mecklenburg County, where Charlotte is located, contains neighborhoods that are 10, 15, even close to 20 miles from its CBD—meaning both the peak and the trough are averaged out in its county numbers.
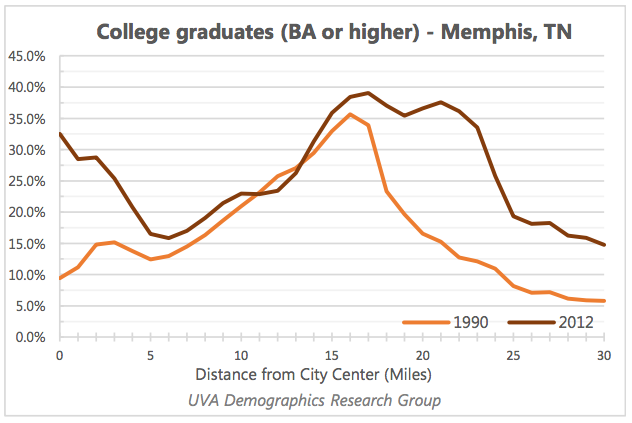
Or take Memphis, TN. It also has a peak-trough pattern (this chart shows college graduates, but the income chart is very similar) that goes about five miles out from its CBD. But Shelby County, where Memphis is located, goes for up to 28 miles from downtown Memphis. Again, county-level numbers combine two diametrically opposed trends into one number that accurately reflects neither.
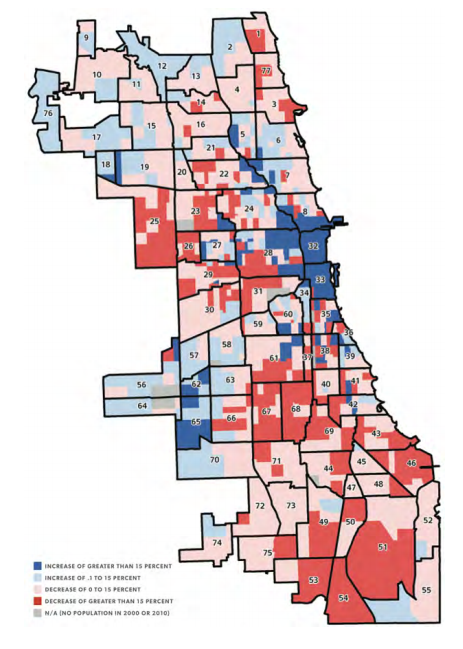
Finally, look at this map of population growth in Chicago in the 2000s. No one could look at this map and conclude that central Chicago wasn’t booming—and that much of the rest of the city was really hurting. But you can erase both of these facts by adding them together. (Not to mention that all of Chicago would be added to the rest of suburban Cook County in the county-level statistics.)
And Charlotte, Chicago, and Memphis are hardly atypical. Phoenix is centered in Maricopa County, which encompasses wide swaths of suburbs, as does Seattle’s King County, and Austin’s Travis County. True, some counties correspond more closely to the urban core: New York County corresponds to the Manhattan, but that’s the exception, rather than the rule. On top of that, counties vary wildly in size, with substantially larger geographies in the West compared to the East.
There are things that county-level data is good for, of course. It can tell us what population growth is for metropolitan areas as a whole, for example, which is a good indicator of regional health.
But claims about the growing economic and demographic strength of urban centers have always been about just that—urban centers. Those centers—and the weakening inner-ring suburbs around them—simply don’t correspond geographically to counties.
Fortunately, we have tract-level data from before 2015, and we can use it to test our actual hypotheses. Juday’s work is an excellent example of that. We will also eventually have tract-level data for 2015, and then we can do the same with those updated numbers.
But in the meanwhile, we shouldn’t let our hammer make us think every question is a nail. There are a lot of interesting things to learn in the new county population numbers—but the question of urban growth, or inner-ring decline, simply isn’t one of them.
