Are cities the latest victim of coronavirus?
Editor’s Note: City Observatory is pleased to publish this guest commentary by Anthony Dedousis of Abundant Housing LA.
Some elected officials and journalists have drawn a link between urban density and the spread of COVID-19. A few anti-urban pundits have gone further, arguing that suburban living patterns are reducing the spread of COVID-19, and using the pandemic as a justification for opposing new apartments in cities.
Reality is more complicated (isn’t it always?) Many dense cities, like Seoul, Taipei, and San Francisco, have experienced relatively few cases of COVID-19, and in the United States, suburbs and rural areas are experiencing some of the nation’s most acute outbreaks.
Nevertheless, living patterns and socioeconomic makeup of cities seem to play a role in the pandemic’s spread. Researchers at Harvard found that counties with high rates of poverty and household overcrowding experienced higher COVID-19 case rates. In Chicago, ProPublica found that neighborhoods with large black and Latino populations were most impacted by COVID-19’s spread.
To better understand these factors, I’ve analyzed COVID-19 case rates and socioeconomic indicators for individual cities within Los Angeles County, and among neighborhoods of the City of Los Angeles. I find that COVID-19 case rates are associated with poverty and household overcrowding, and that urban density is, at best, a weak predictor of COVID-19 cases. The link between COVID-19, poverty, and household overcrowding also helps to explain why the disease disproportionately afflicts communities of color.
A quick note: the analysis is limited to cities and neighborhoods with 20 or more COVID-19 cases as of May 7, 2020. I used COVID-19 data from the LA County Department of Public Health, and socioeconomic data from the USC Neighborhood Data for Social Change. Here’s a link to the combined dataset and R code.
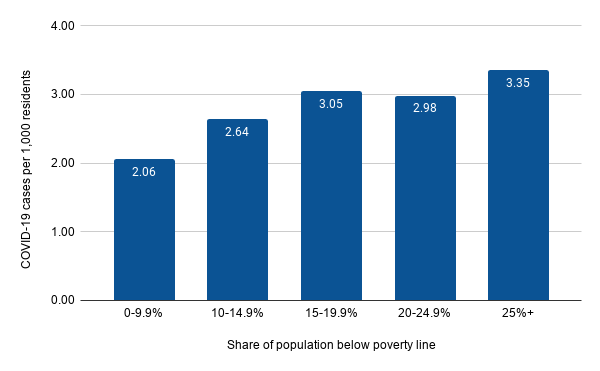
First, I calculated the average COVID-19 case rate across quintiles of L.A. County localities, based on the share of the population living below the poverty line. The poorer the neighborhood group, the higher the COVID-19 rate.
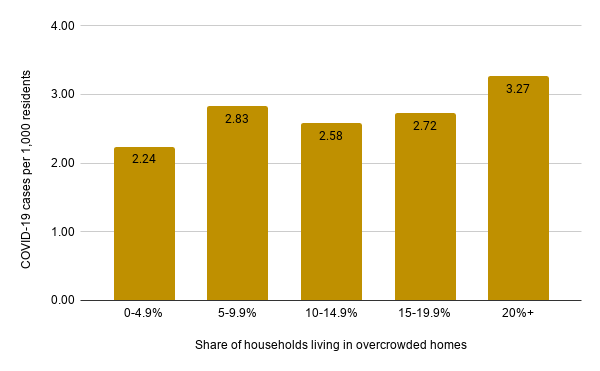
There’s a similar trend for the share of households living in overcrowded conditions (defined as a household with more than one adult per room, not counting the kitchen or bathrooms). Localities with the highest share of households living in overcrowded conditions have the highest COVID-19 rates. This makes sense: COVID-19 spreads easily among family members living in close quarters, and people living in overcrowded conditions are likelier to be poor.
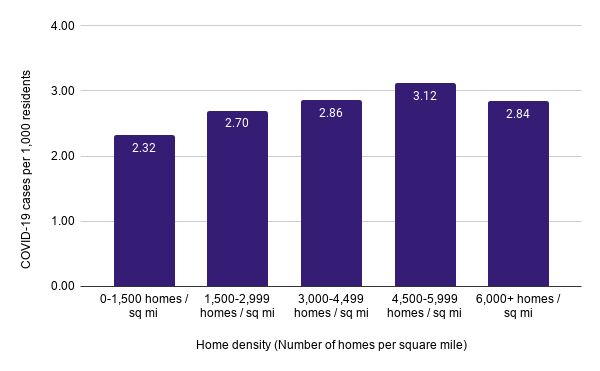
Finally, when we analyze neighborhoods’ housing density (the number of housing units per square mile), we can see that the densest areas are not experiencing the highest COVID-19 rates. The most dense quintile has roughly the same COVID-19 case rate as the middle density quintile. This calls the “density = COVID” narrative into question.
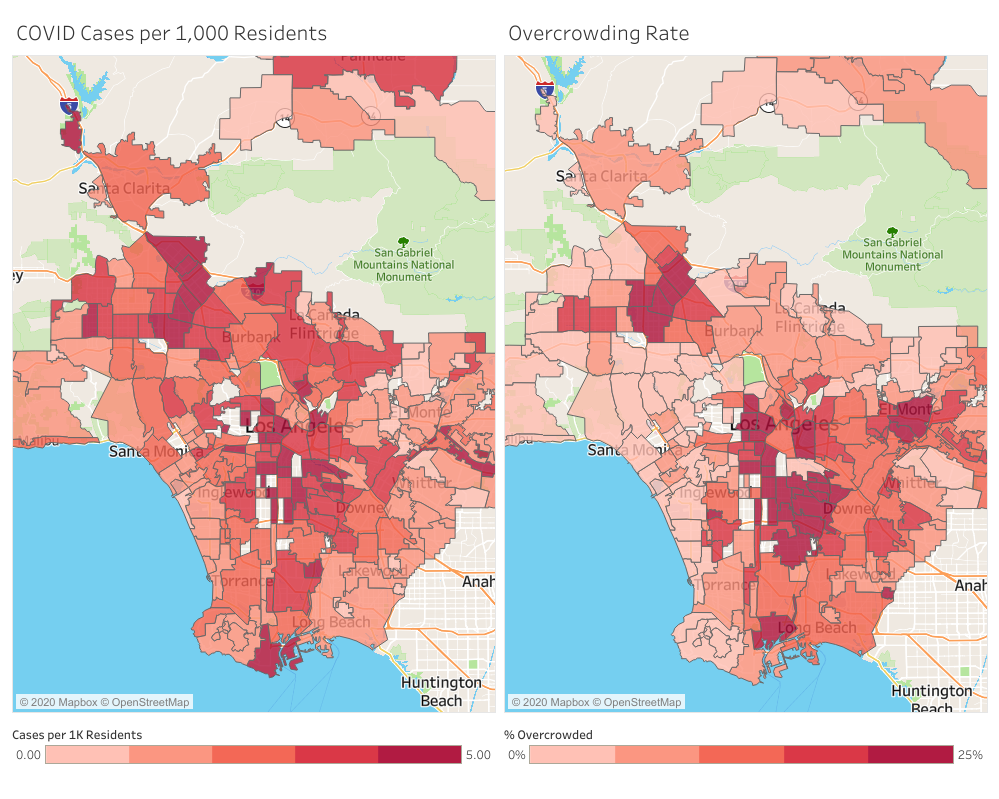
Next, I mapped COVID-19 case rates (darker red means higher COVID case rates):
COVID-19 cases per 1,000 residents
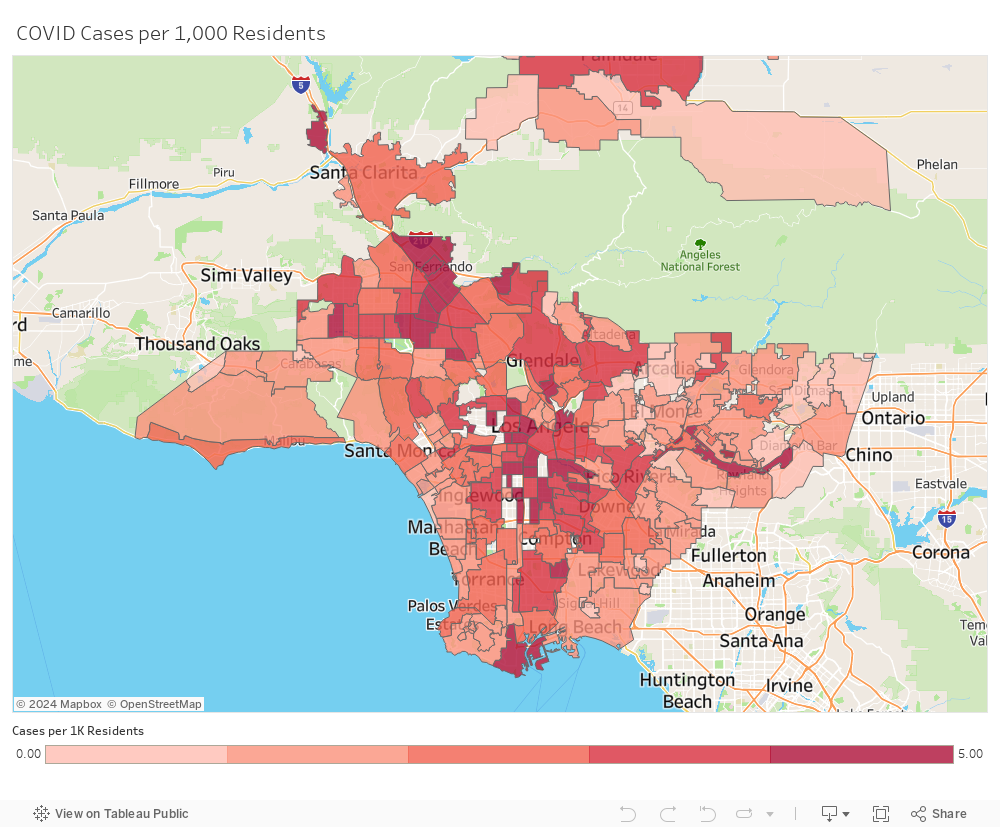
Although we don’t have data for every locality, we can observe “COVID clusters” in:
- The north San Fernando Valley, especially in the Sylmar, Pacoima, Panorama City, and Van Nuys neighborhoods of Los Angeles
- Central Los Angeles, especially in the Westlake, East Hollywood, and Pico-Union neighborhoods
- South Los Angeles, especially in the South-Central, Vermont Square, and Florence-Firestone neighborhoods
When we compare this map to a map showing overcrowding rates by locality, we observe very similar patterns. Neighborhoods in the north San Fernando Valley, Central LA, and South LA have the highest rates of overcrowding and the highest COVID-19 case rates.
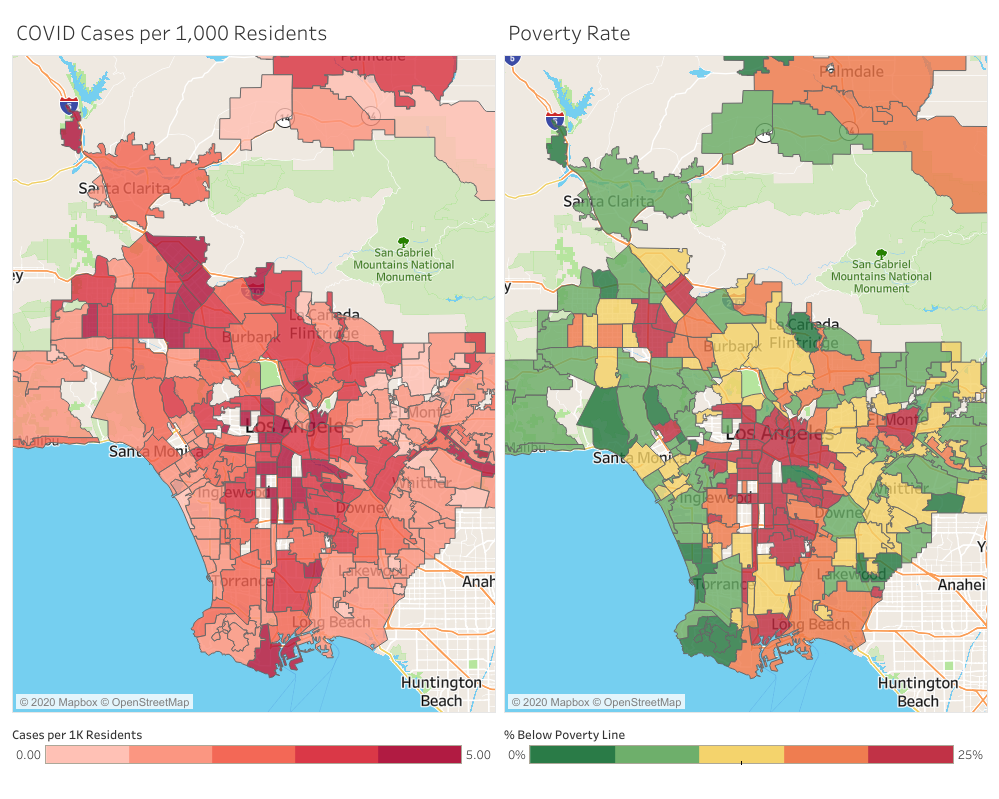
Similar patterns appear when we compare COVID rates to neighborhood poverty rates. The COVID clusters generally appear in localities with high poverty levels, although there are certainly poor neighborhoods that have relatively low COVID rates.
What about housing density? By comparing the COVID map to a map of housing density (more housing-dense areas appear darker green), we see that density does not neatly align with COVID-19 case rates. It is true that housing-dense parts of Central LA, like Westlake and East Hollywood, have high COVID-19 case rates, and that suburban, spread-out areas in the San Gabriel Valley have low COVID-19 incidence.
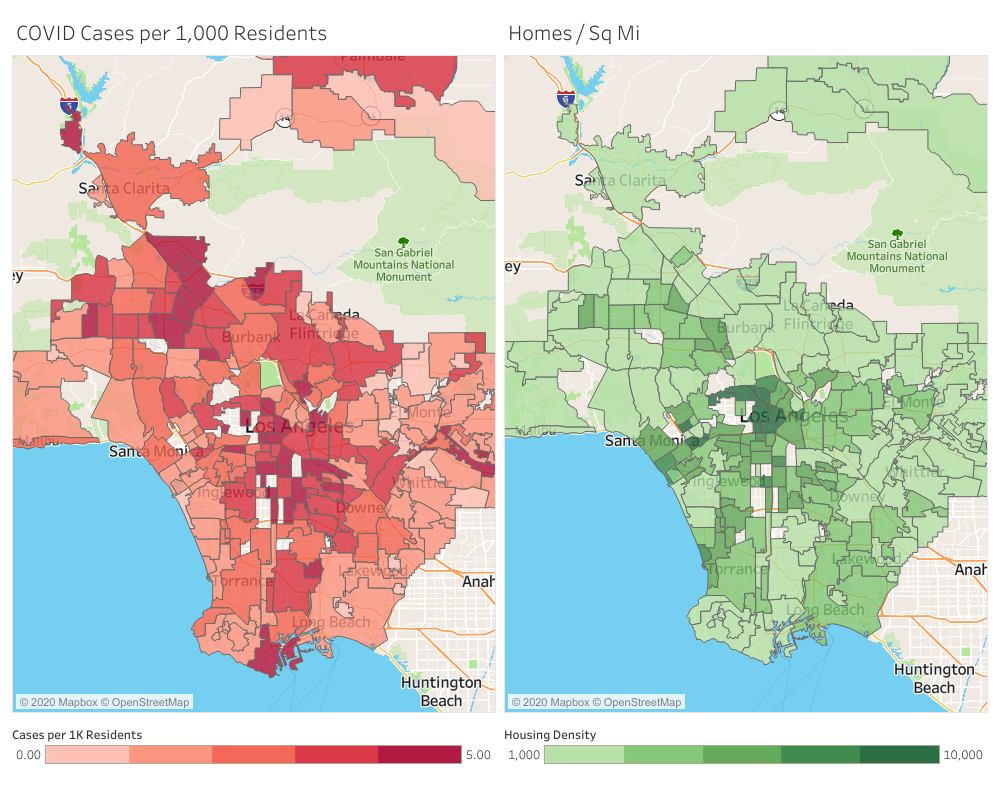
But neighborhoods in South LA and the San Fernando Valley are epicenters of the pandemic, despite not being very dense. And some relatively housing-dense areas, like Santa Monica and Venice, have low COVID-19 case rates. It’s a more complicated relationship than “more housing equals more COVID”.
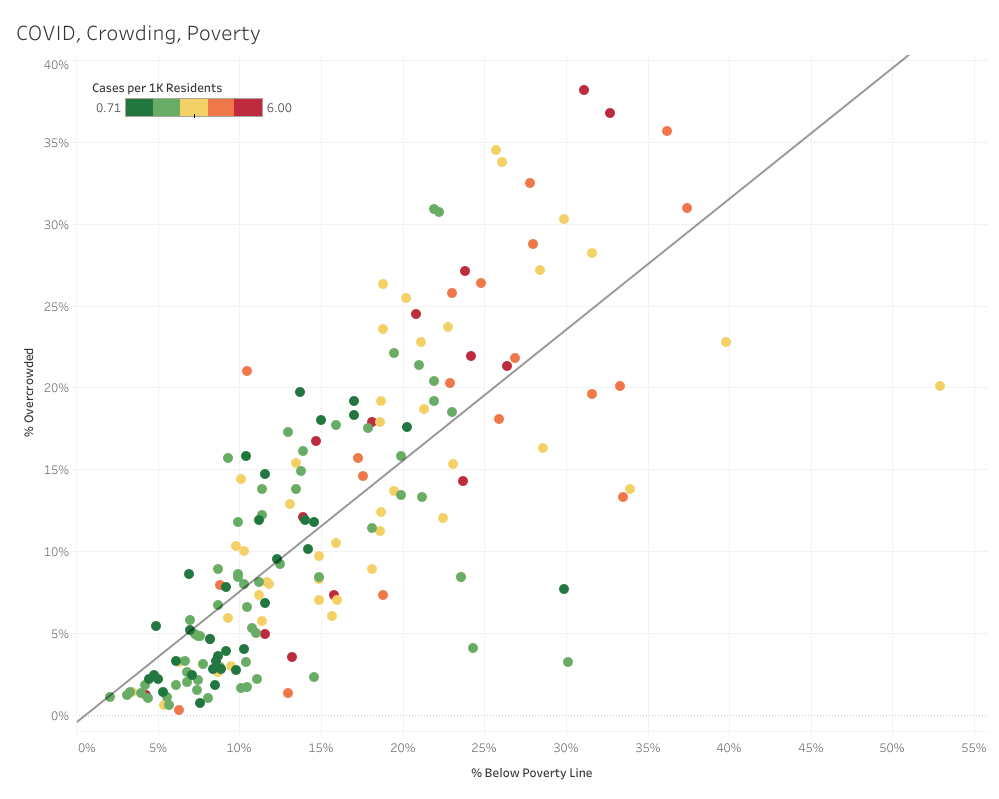
Next, to illustrate how poverty and overcrowding are associated with COVID-19 incidence, I graphed L.A. County localities on a scatterplot (poverty rate is on the x-axis; overcrowding rate is on the y-axis), and colored the dots based on the locality’s COVID-19 incidence (green means low case rate; yellow means moderate; red means high). This shows that neighborhoods with high COVID-19 incidence tend to have high overcrowding and high poverty rates.
Finally, like any self-respecting data nerd, I ran a regression to estimate the extent to which the combination of these variables — household overcrowding, poverty rate, minority groups’ population share, and housing density — predict a locality’s COVID-19 case rate:
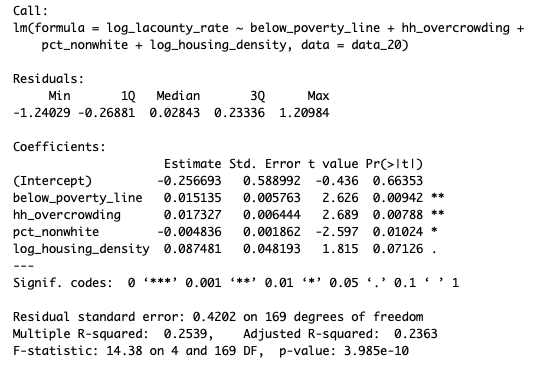
These results indicate that poverty, household overcrowding, and race are strong predictors of a neighborhood or city’s vulnerability to COVID-19. Housing density does not have a clear causal relationship with the COVID-19 case rate.
Additionally:
- A 1-percentage point increase in a locality’s poverty rate is associated with a 1.5% increase in the COVID-19 case rate.
- A 1-percentage point increase in a locality’s overcrowding rate is associated with a 1.7% increase in the COVID-19 case rate.
- A 1-percentage point increase in a locality’s minority group population share is associated with a 0.5% decrease in the COVID-19 case rate. (This was surprising to me, since black and Latino communities, which experience higher rates of poverty than average, have been hard-hit by COVID-19. The model may have already accounted for this by including poverty and overcrowding as variables.)
Finally, I’d offer three observations based on this research, to help policymakers respond more effectively to the immediate emergency, and improve urban life for everyone post-coronavirus:
- Low-income and minority communities need more health resources. Free COVID-19 testing and space for patients to quarantine should be made widely available in low-income and minority communities, and resourcing for community health centers and local hospitals in poor neighborhoods must improve.
- More housing means less overcrowding. California’s housing shortage impacts low-income communities the most; when renters are unable to afford adequate homes, they are forced into overcrowded living situations. More apartments in more neighborhoods can lower rents and relieve overcrowding.
- Neighborhoods need more public space. With people spending more time outside as a break from sheltering at home, L.A.’s lack of green space and pedestrian space has become more acutely noticeable. New parks, more bike lanes, and wider sidewalks will help accommodate greater demand for outdoor space.
Anthony Dedousis (@anthonydedousis) is director of policy and research for Abundant Housing L.A., a pro-housing education and advocacy organization serving Southern California.