Cops per capita: An indicator of “Anti-social” capital?”
Why do some cities have vastly fewer police officers relative to their population than others?
In the 1966 film “The Thin Blue Line” director William Friedkin explored the role police officers played in protecting the broader populace from violence and disorder. As we’ve frequently noted at City Observatory, there’s been a marked, and in many ways, under-appreciated decline in crime rates in American cities. In the typical large city, crime is less than half what it was when Friedkin filmed. Interestingly, the thickness of the “blue line” varies widely across US metro areas. We think that’s a possible indicator of which places perceive they need more police in order to live safely. The fact that some cities have far fewer police than others suggests that social capital and other factors deterring crime may be more important in explaining variations in crime rates.

Previously, we’ve used counts of the number of security guards per capita as an indicator of “anti-social” capital. Our measurement built on the idea of social capital explained by Robert Putnam, in his book Bowling Alone. Putnam developed a clever series of statistics for measuring social capital. He looked at survey data about interpersonal trust (can most people be trusted?) as well as behavioral data (do people regularly visit neighbors, attend public meetings, belong to civic organizations?). Putnam’s measures try to capture the extent to which social interaction is underpinned by widely shared norms of openness and reciprocity.
It seems logical to assume that there are some characteristics of place which signify the absence of social capital. One of these is the amount of effort that people spend to protect their lives and property. In a trusting utopia, we might give little thought to locking our doors or thinking about a “safe” route to travel. In a more troubled community, we have to devote more of our time, energy, and work to looking over our shoulders and protecting what we have.
We argued that the presence of security guards in a place is arguably a good indicator of this “negative social capital.” Guards are needed because a place otherwise lacks the norms of reciprocity that are needed to assure good order and behavior. The steady increase in the number of security guards and the number of places (apartments, dormitories, public buildings) to which access is secured by guards indicates the absence of trust.
Might the same notion apply to public safety officers? If some places feel the need to hire more police to feel safe, doesn’t that suggest an absence of social capital? A few weeks back, we were introduced to an analysis of the police to population ratio by state. Compiled by Bill McGonigle, this analysis used data from the FBI’s Crime in the United States, to estimate the total number of police in each state, and then divided the result by population. That got us thinking about creating a similar index for metropolitan areas. The FBI’s data aren’t reported by MSA, so instead we looked to the Census Bureau.
We undertake this comparison at the metropolitan level, using data from the Census Bureau’s American Community Survey. For the most part, using metro data nets out the effects of the wide variations in the demographics of central city boundaries from place to place, which tends to confound municipal comparisons. (For example, the cities of Miami and Atlanta include less than 10 percent of the population of their metro areas, while Jacksonville and San Antonio include a majority, including areas that would be regarded as “suburban” elsewhere.)The ACS asks respondents about their occupation, three occupations correspond to police officers:
3710: First-line supervisors of police and detectives
3820: Detectives and criminal investigators
3870: Police officers
We used the University of Minnesota’s invaluable IPUMS* data source to tabulate these data by metropolitan area. The underlying data are from the 2014-2018 five-year American Community Survey. There’s one underlying quirk of the ACS data to be aware of: respondents are classified according to where they live, rather than where they work. Because most metropolitan areas are large and encompass entire labor markets, that’s a reasonably accurate way of counting; but in some metro areas, where people commute from outside the metro area, this may not accurate count the number of police employed locally.
When we tabulate the data for metropolitan areas with a million or more population, and divide the number of police by the population of each metro area, we get the following ranking. (We report the number of police officers per 1,000 population, metro areas with the fewest police per capita are shown at the top of the list).
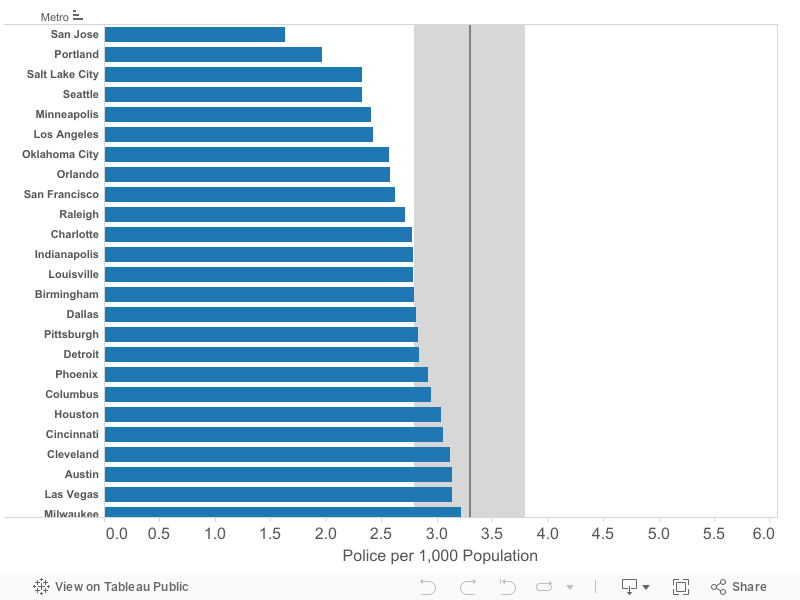
There’s a wide variation in the number of police per capita across metro areas. While the median metropolitan area has about 3.3 police officers per 1,000 population, some have as few as 2.4, while others have 5 or more.
The cities with the fewest police officers include San Jose, Portland, Salt Lake City, Minneapolis and Seattle. The top cities on our list mostly coincide with the top states on McGonigle’s list of police population ratios. Oregon, Washington, Minnesota and Utah rank first, second, fourth and fifth, respectively, of the state’s with the fewest police officers per capita. (The Twin Cities, Seattle, Salt Lake and Portland also do well on most of Putnam’s measures of social capital).
Recall that our data is on the number of police living in each metro area. We suspect that the relatively low number of police per thousand population in San Jose (1.6) and Los Angeles (2.4) reflects the high cost of housing and long distance commuting in these areas. Riverside, which is adjacent to Los Angeles has a much higher than average number of police per 1,000 population (4.50). It seems likely that proportionately more police officers commute from adjacent areas outside the Los Angeles and San Jose metro areas which have lower housing costs.
The metro areas with the most police officers per capita include Virginia Beach, Las Vegas, and Miami. Some of the cities with high numbers of police fit our media stereotypes: Law and Order (New York) and The Wire (Baltimore) both rank in the top five for police per capita, both have at least 50 percent more police per capita than the typical large metro in the US.
Security Guards and Police Officers
As we mentioned, we’ve previously looked at the number of security guards per capita as another indicator of “anti-social capital.” We thought we’d look at the relationship between the number of police officers per capita and the number of security guards per capita. In theory, it might be the case that private security guards could be filling a gap, i.e. more common in places where the public sector isn’t providing “enough” security. Or alternatively, it could be that fear or security concerns could lead to having both more public police and more security guards in some cities, and fewer in others.
The data strongly support the latter interpretation. The following chart shows the per capita number of police (from the chart above) and the per capita number of security guards (from the same ACS survey from which we drew our police officer counts). Each dot represents one of the largest US metro areas. We’ve excluded three metro areas from our calculations: San Jose and Los Angeles (because of the commuting issue discussed above) and Las Vegas, because it is a wide outlier, with far more security guards per capita than any other city.
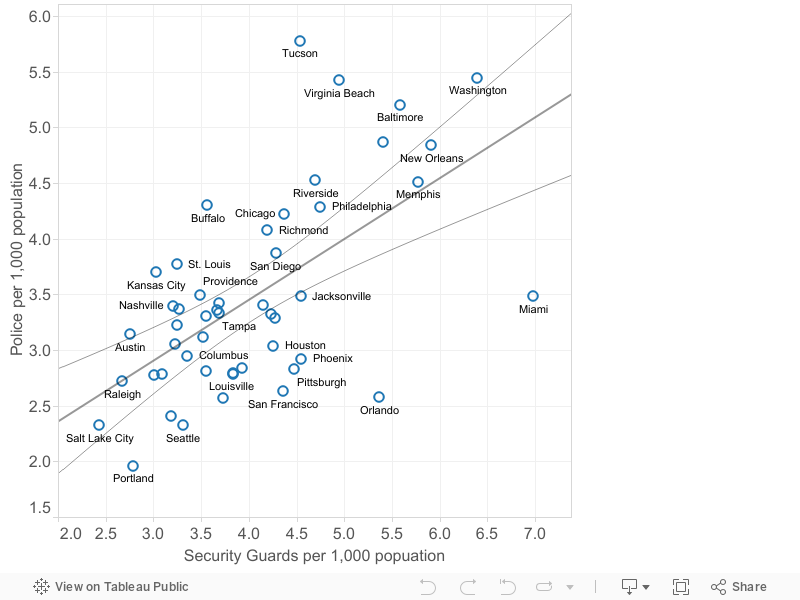
There’s a strong positive correlation between the number of police per capita and the number of security guards per capita in a metropolitan area. Places that tend to have more police, also tend to have more security guards. Portland, Seattle and Minneapolis all rank low in both the number of security guards and police per capita. Conversely, New York, Washington, Baltimore and New Orleans have high numbers of both police and security guards. Most cities fall relatively close to the regression line we’ve plotted on the chart, but there are some outliers. Miami and Orlando have relatively more private security guards than police; while Virginia Beach has many more police than security guards. This tends to reinforce our view that out metric is reflecting anti-social capital, or perhaps more accurately, the absence of social capital in some cities. Both the public sector and the private sector spend considerably more resources in some metro areas than others in order to protect persons and property, almost certainly because they believe that localized norms of behavior and reciprocity are inadequate.
* – Steven Ruggles, Sarah Flood, Ronald Goeken, Josiah Grover, Erin Meyer, Jose Pacas and Matthew Sobek. IPUMS USA: Version 10.0 [dataset]. Minneapolis, MN: IPUMS, 2020. https://doi.org/10.18128/D010.V10.0
